LLM 스터디 6주차 - Scaling LLM Inference with vLLM and AWS Trainium Workshop
AWS Workshop 아키텍처 : Amazon EKS 기반 vLLM을 활용한 엔터프라이즈 규모의 대규모 언어 모델(LLM) 배포
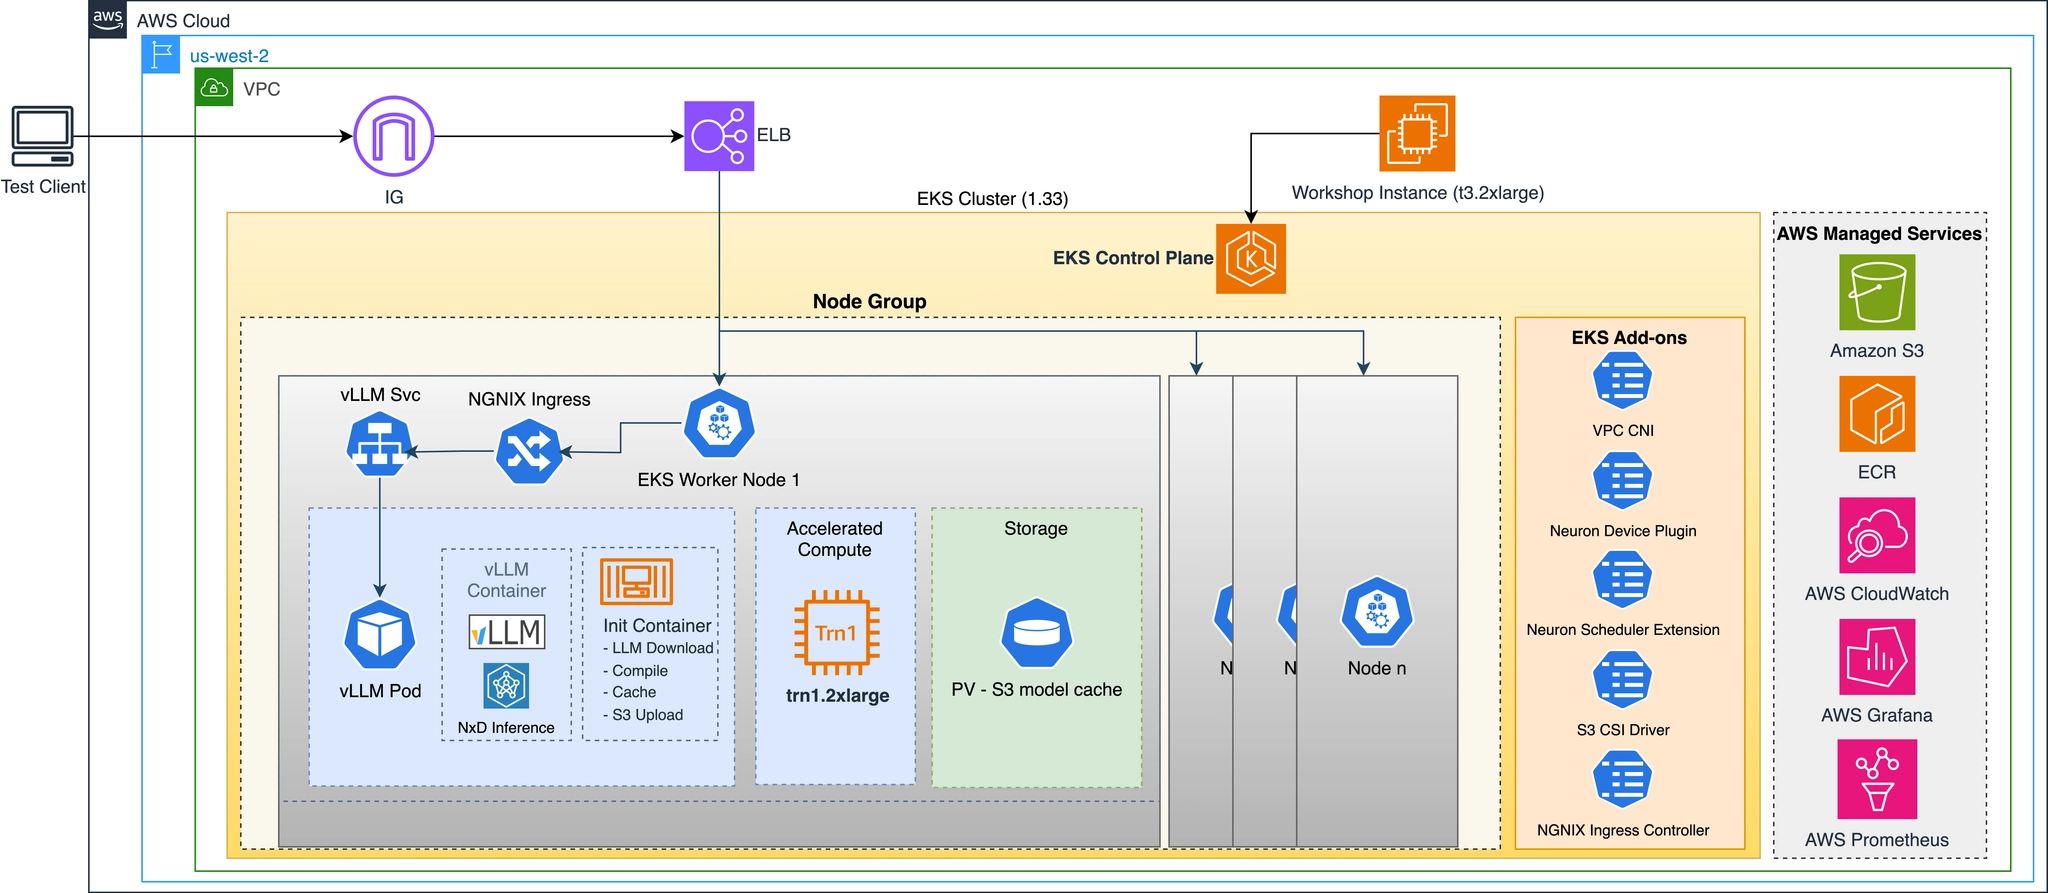
- 인프라 레이어: t3.2xlarge Ubuntu 22.04 EC2(개발 환경), VPC 10.0.0.0/16 + public subnet 10.0.1.0/24, SG(22/8000/8080), EKS/ECR/S3/CFN용 IAM Role
- EKS 클러스터: K8s 1.33, VPC CNI + OIDC, managed node group
neuron-trn1-2x(trn1.2xlarge, Neuron-optimized AMI, GP2 100GB, 멀티 AZ) - Trainium 통합: Neuron device plugin(daemonset), Neuron scheduler extension(
my-scheduler), 칩당 NeuronCore-v2 2개(380 INT8 TOPS), HBM 32GB @820GB/s - vLLM 배포: 컨테이너 이미지
public.ecr.aws/neuron/pytorch-inference-vllm-neuronx:0.9.1-neuronx-py310-sdk2.25.0-ubuntu22.04, Init Container 패턴으로 모델 컴파일/캐싱, 대상 모델 TinyLlama-1.1B-Chat-v1.0, tensor-parallel-size=2 - 스토리지: S3 버킷
ai-infra-summit-vllm-models-cache-{ACCOUNT_ID}(컴파일 아티팩트 캐시), S3 CSI Driver(Mountpoint) + PV/PVC(100Gi, ReadWriteMany) - 네트워크/Ingress: Service(LoadBalancer, 8080), NGINX Ingress Controller(경로 기반 라우팅
/) - 최적화 기술: Continuous batching, OpenAI 호환 API, Tensor/Pipeline Parallelism, Memory pooling, Speculative decoding
- 모니터링: K8s 리소스 모니터링, readiness/liveness probe, Prometheus/Grafana/CloudWatch(Lab 4)
실습 환경에서 실제로 확인된 값
위 구성도는 워크숍이 제시하는 목표 아키텍처다. Lab1~Lab5를 진행하며 실제로 측정한 값과 대조하면 다음과 같다.
| 항목 | 구성도 | 실측 |
|---|---|---|
| EC2 | t3.2xlarge, Ubuntu 22.04 | 일치 (hostnamectl) |
| VPC / subnet | 10.0.0.0/16, public 10.0.1.0/24 | 일치. EC2는 10.0.1.x, 워커노드는 10.0.5.x |
| EKS | K8s 1.33 | 일치 (v1.33.13-eks-cb19647) |
| node volume | GP2 100GB | 일치 (ephemeral-storage 104779756Ki) |
| Neuron | 칩당 NeuronCore 2개, HBM 32GB | 일치 (neuron-ls, allocatable neuroncore: 2) |
| 컨테이너 이미지 | ...vllm-neuronx:0.9.1-...sdk2.25.0... | 일치 (ctr images ls) |
| tensor-parallel-size | 2 | 일치 (tp_degree: 2, world_size: 2) |
| S3 캐시 | 컴파일 아티팩트 | 일치 (11개 객체, 약 10MB) |
| PV / PVC | 100Gi, ReadWriteMany | 일치 (Bound, s3.csi.aws.com) |
| Service / Ingress | LoadBalancer 8080, NGINX path / | 일치 (Classic ELB 2개 생성) |
다섯 항목은 구성도와 실제가 달랐다.
OIDC는 활성화되어 있지 않다. cluster에 OIDC issuer URL은 있지만 IAM에 identity provider가 등록되지 않아 IRSA를 쓸 수 없다.
$ aws iam list-open-id-connect-providers
{
    "OpenIDConnectProviderList": []
}
그래서 Mountpoint S3 CSI driver가 ServiceAccount가 아니라 node IAM role의 AmazonS3FullAccess로 bucket에 접근한다. node group 정의에 S3 권한을 넣어둔 이유가 이것이다.
멀티 AZ는 subnet 수준에서만 성립한다. node group은 us-west-2b와 us-west-2d 두 subnet에 걸쳐 있지만 desiredCapacity: 1이라 실제 노드는 us-west-2b 한 대뿐이다. AZ 장애 시 가용성은 없다.
Pipeline Parallelism은 쓰이지 않는다. 적용된 것은 Tensor Parallelism(TP=2)뿐이고, 컴파일 결과의 neuron_config가 이를 보여준다.
"tp_degree": 2,
"pp_degree": 1,
"cp_degree": 1,
"ep_degree": 1trn1.2xlarge는 Trainium chip이 1개(NeuronCore 2개)라 TP로 두 코어를 모두 쓰면 나눌 축이 더 없다. PP는 칩이 여러 개일 때 의미가 생긴다.
Speculative decoding도 쓰이지 않는다. vLLM on Neuron이 지원하는 기능이지만 이번 배포에서는 꺼져 있다.
"speculation_length": 0,
"enable_fused_speculation": false,
"enable_eagle_speculation": false,
"num_medusa_heads": 0
CloudWatch는 제외했다. Lab4에서 Prometheus와 Grafana만 구성했다.
한 가지 더, 구성도의 SG(22/8000/8080)는 inbound 기준이다. outbound는 53/80/443만 열려 있어서 workshop EC2에서 8080 포트의 ELB로 직접 호출하면 timeout이 난다. 워커노드로 SSH(22)가 안 되는 것도 같은 이유다. 자세한 내용은 Lab3과 Lab5에서 다룬다.
Lab0: 사전준비
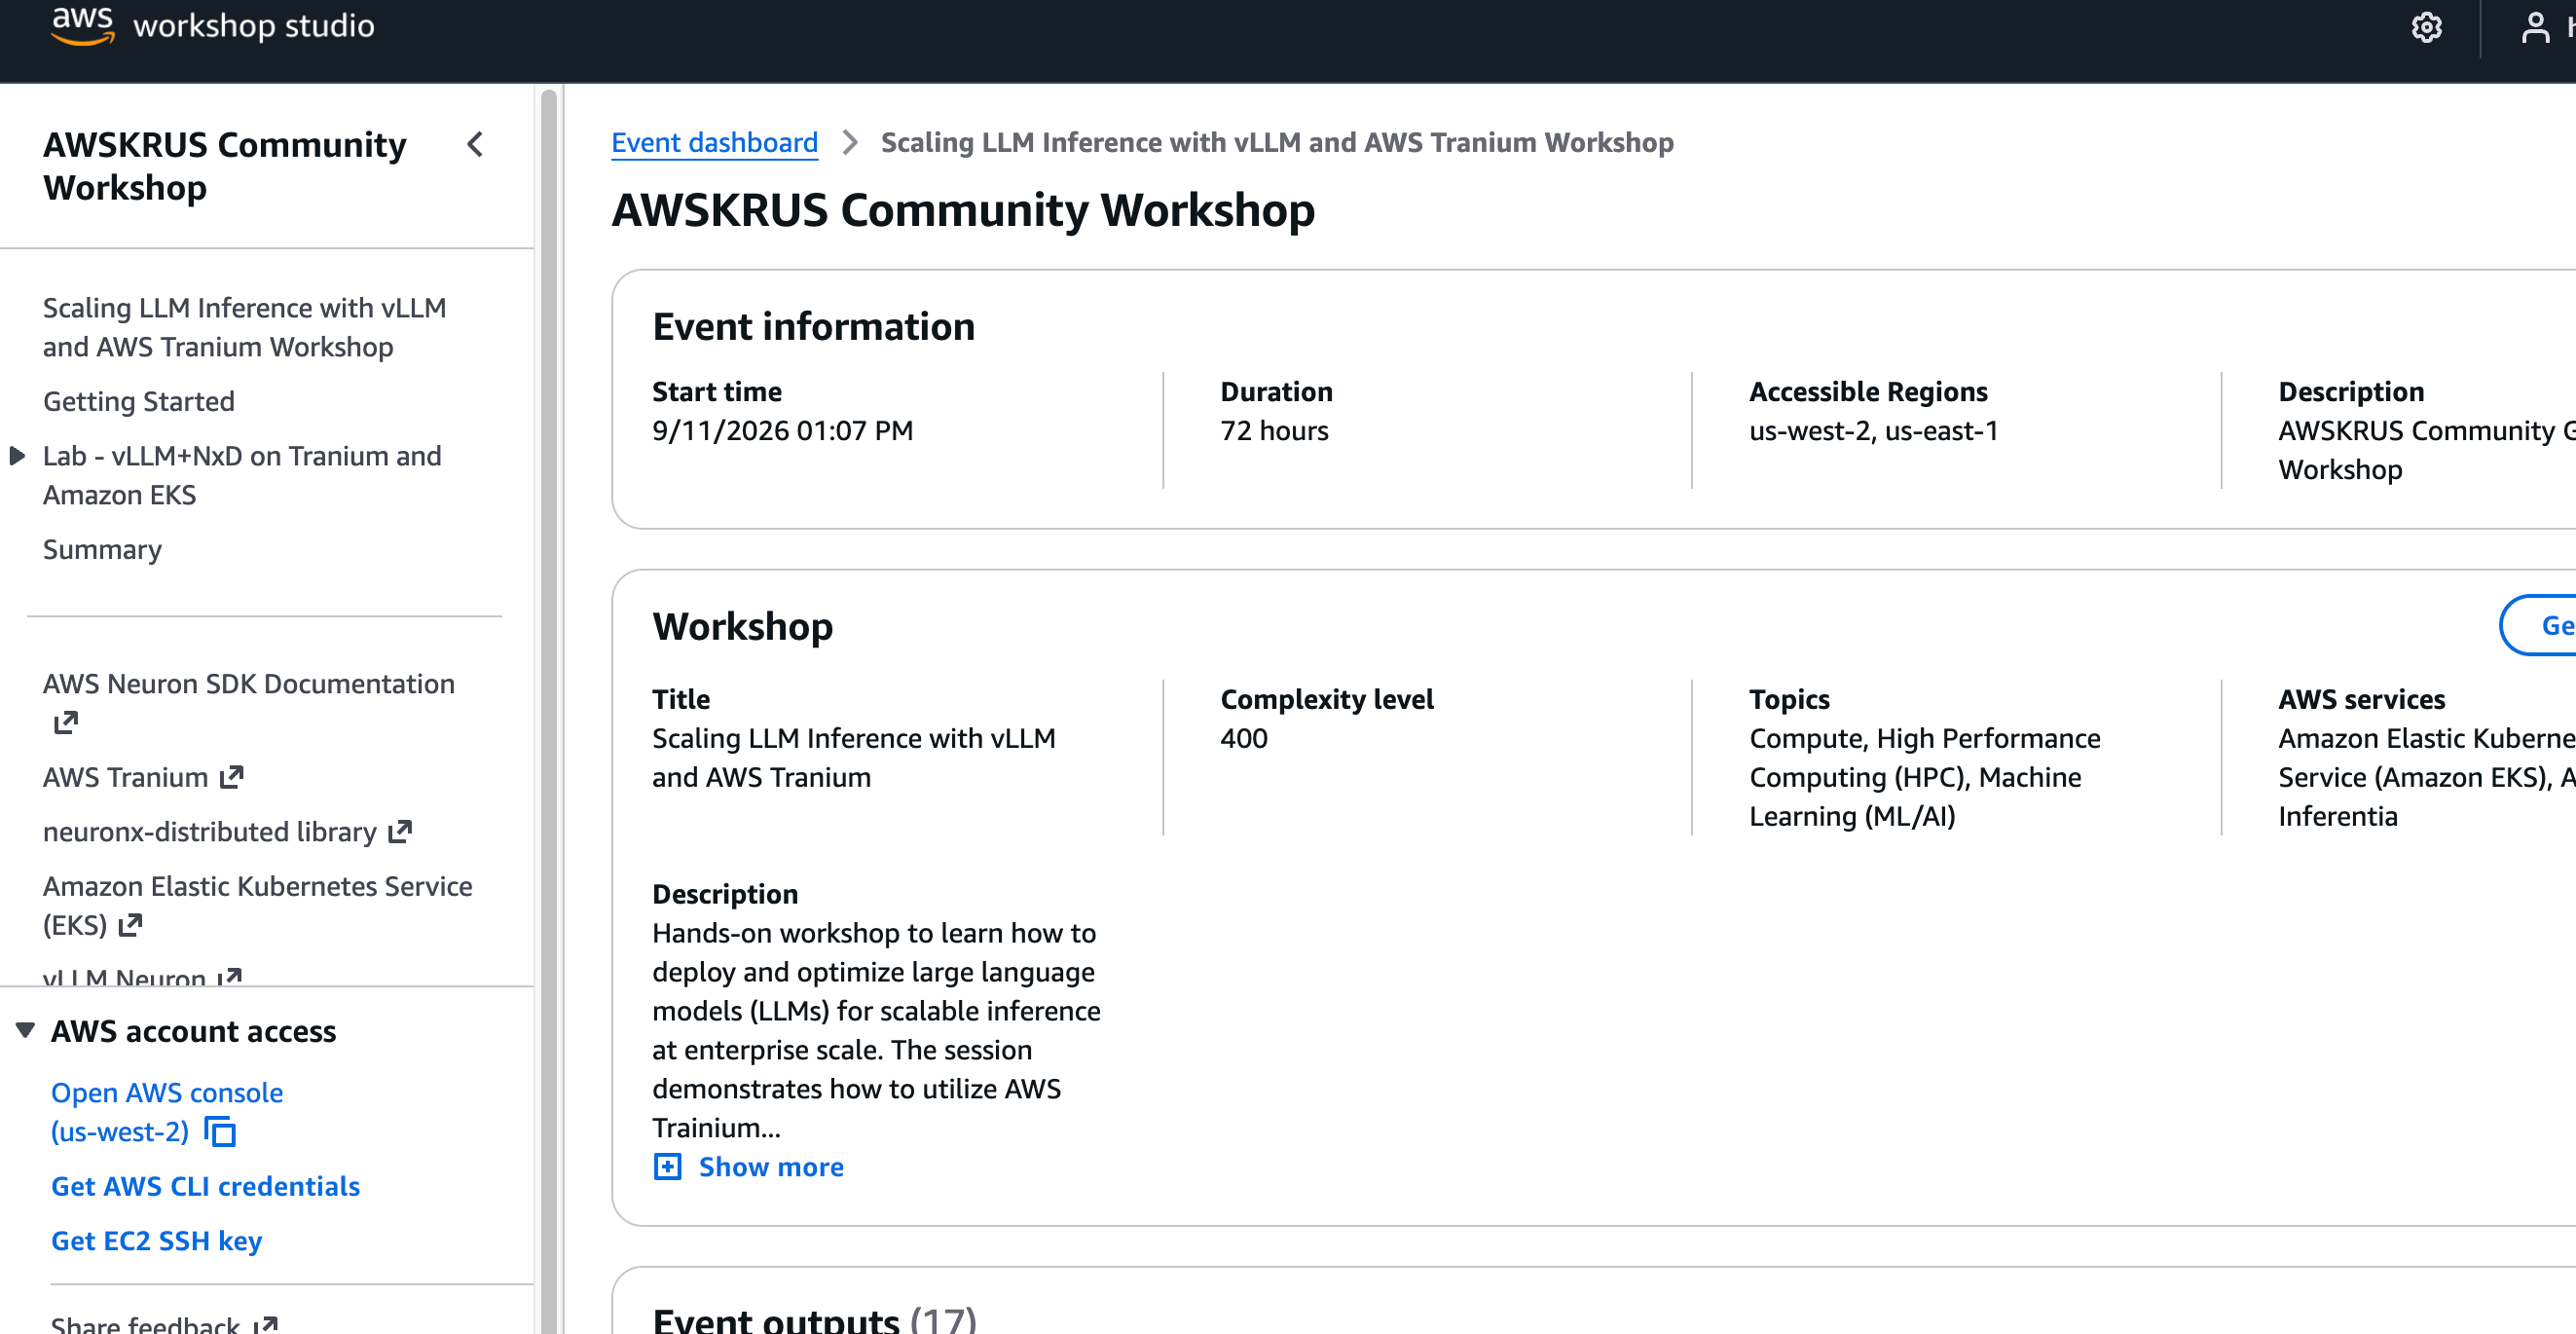
- 콘솔확인
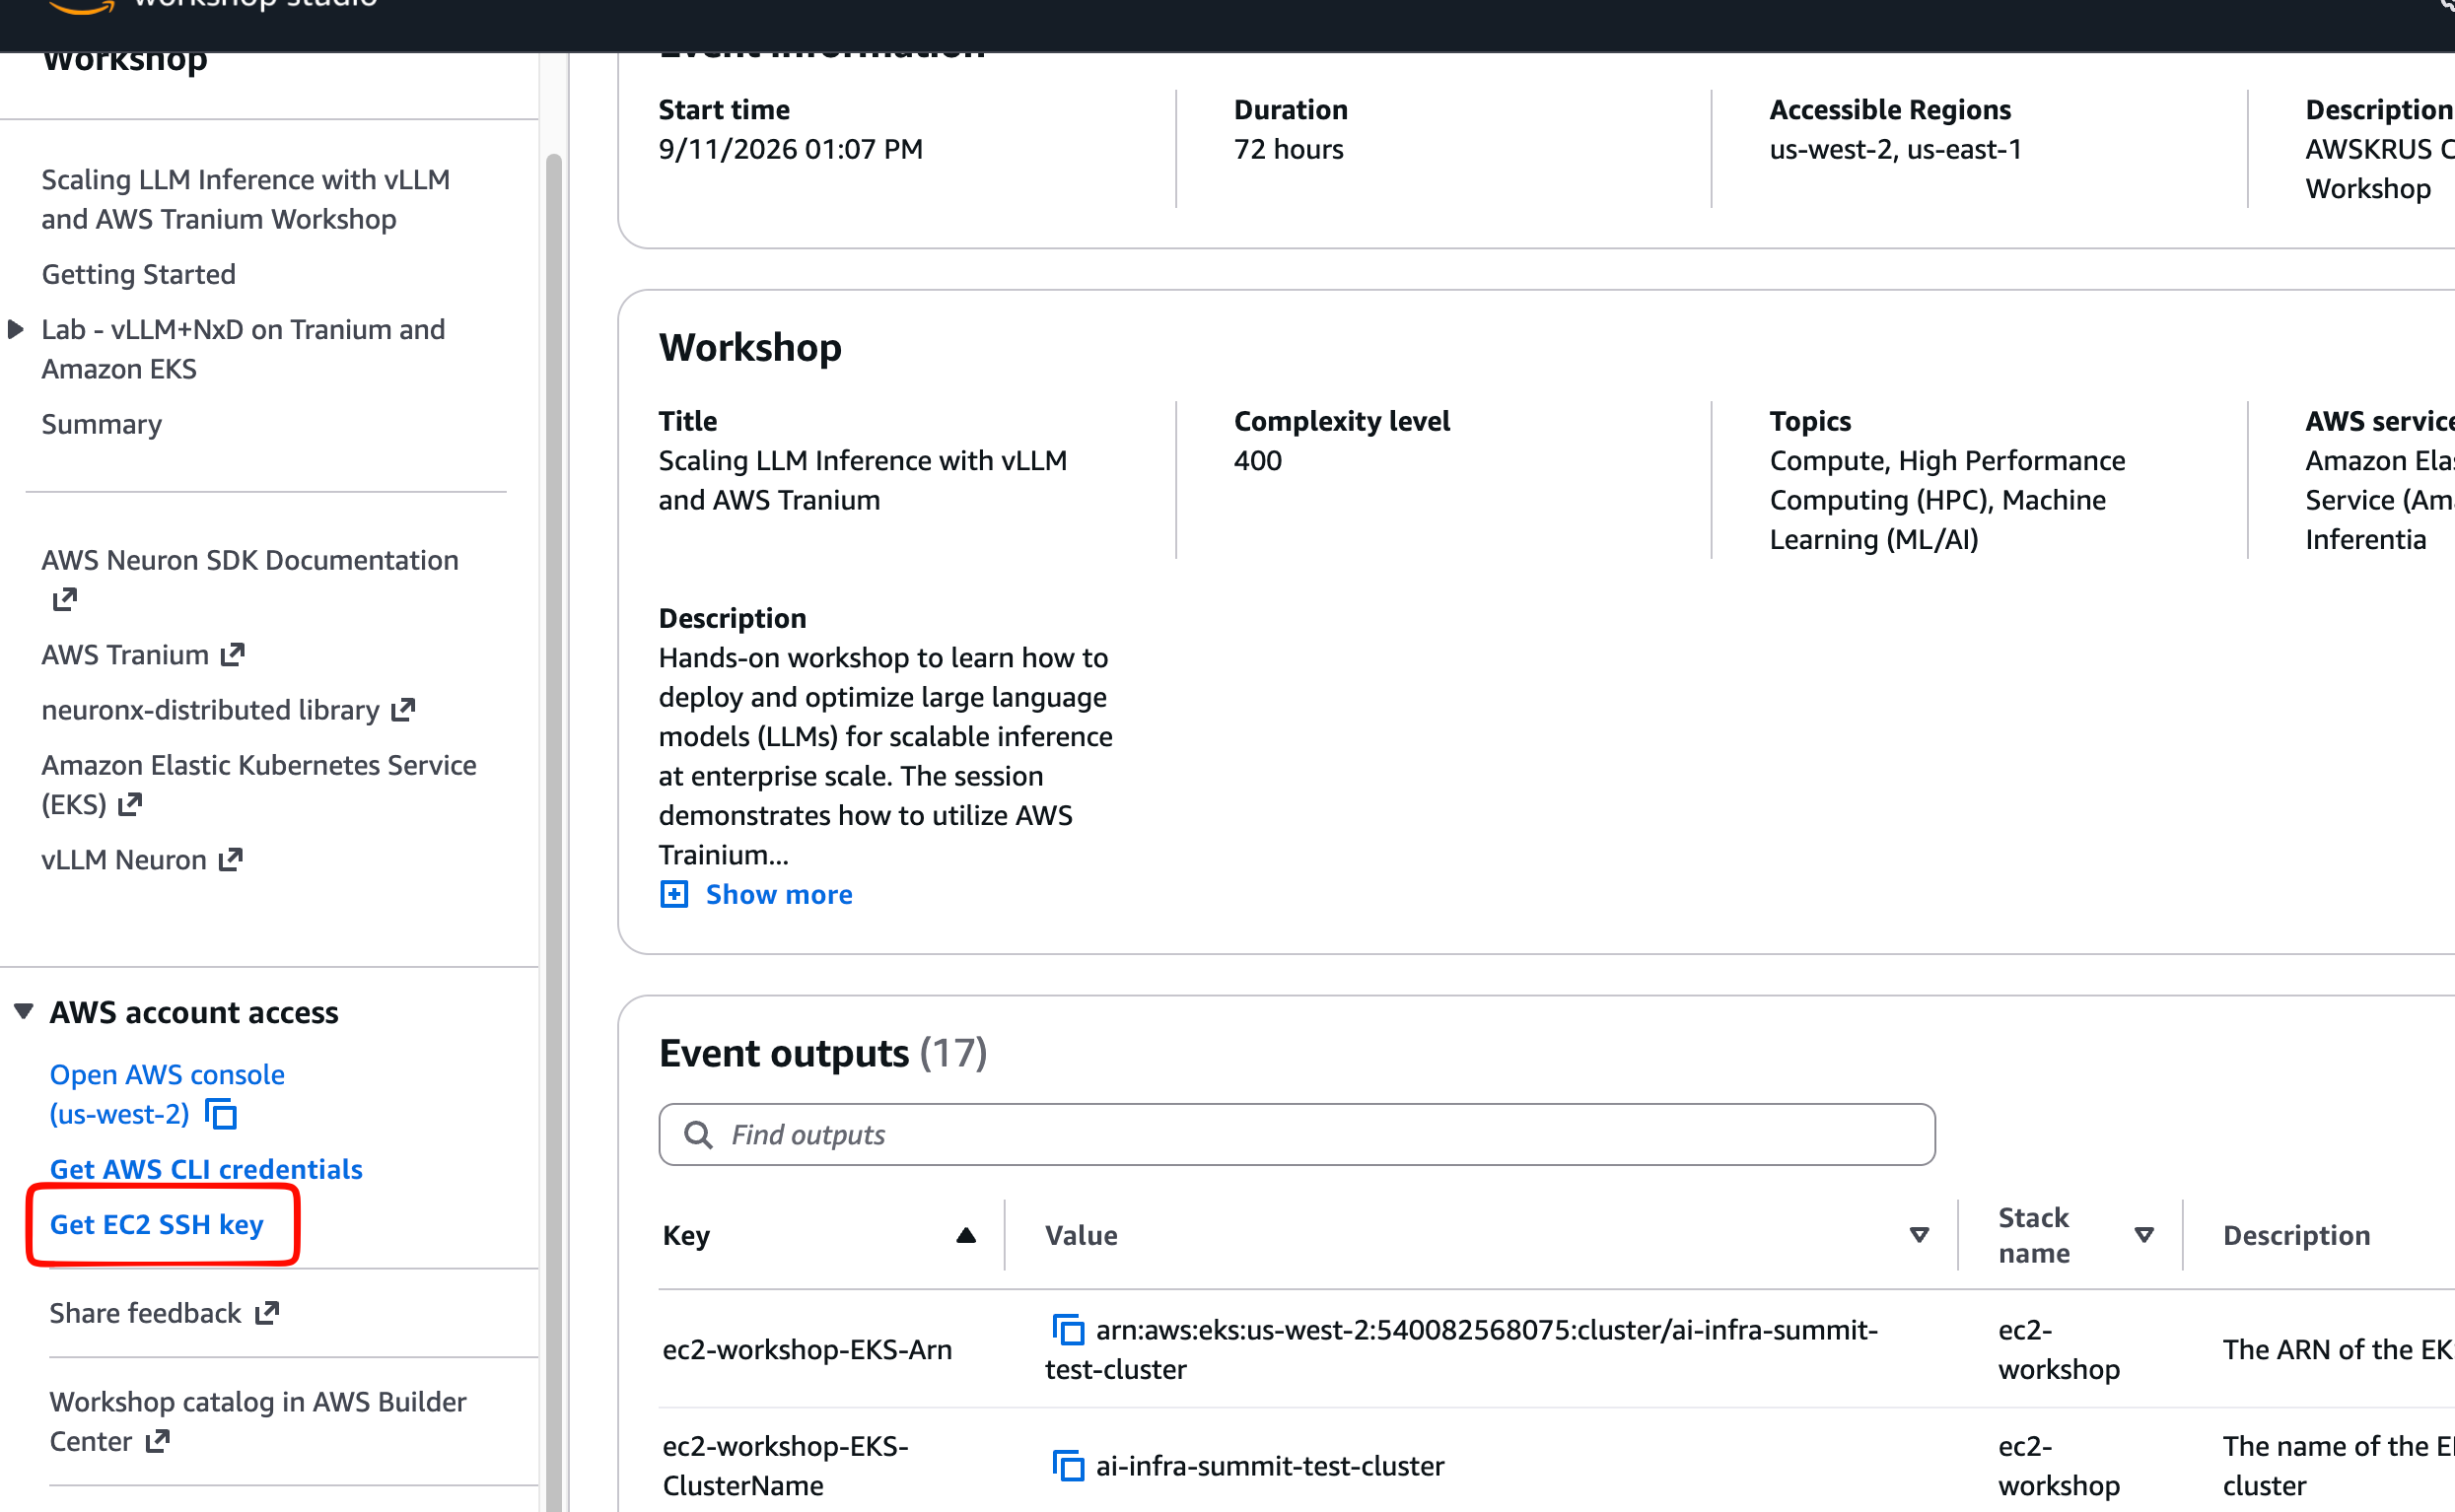
- 로컬 PC에 ssh 개인키 다운로드
- 로컬에서 EC2 접속
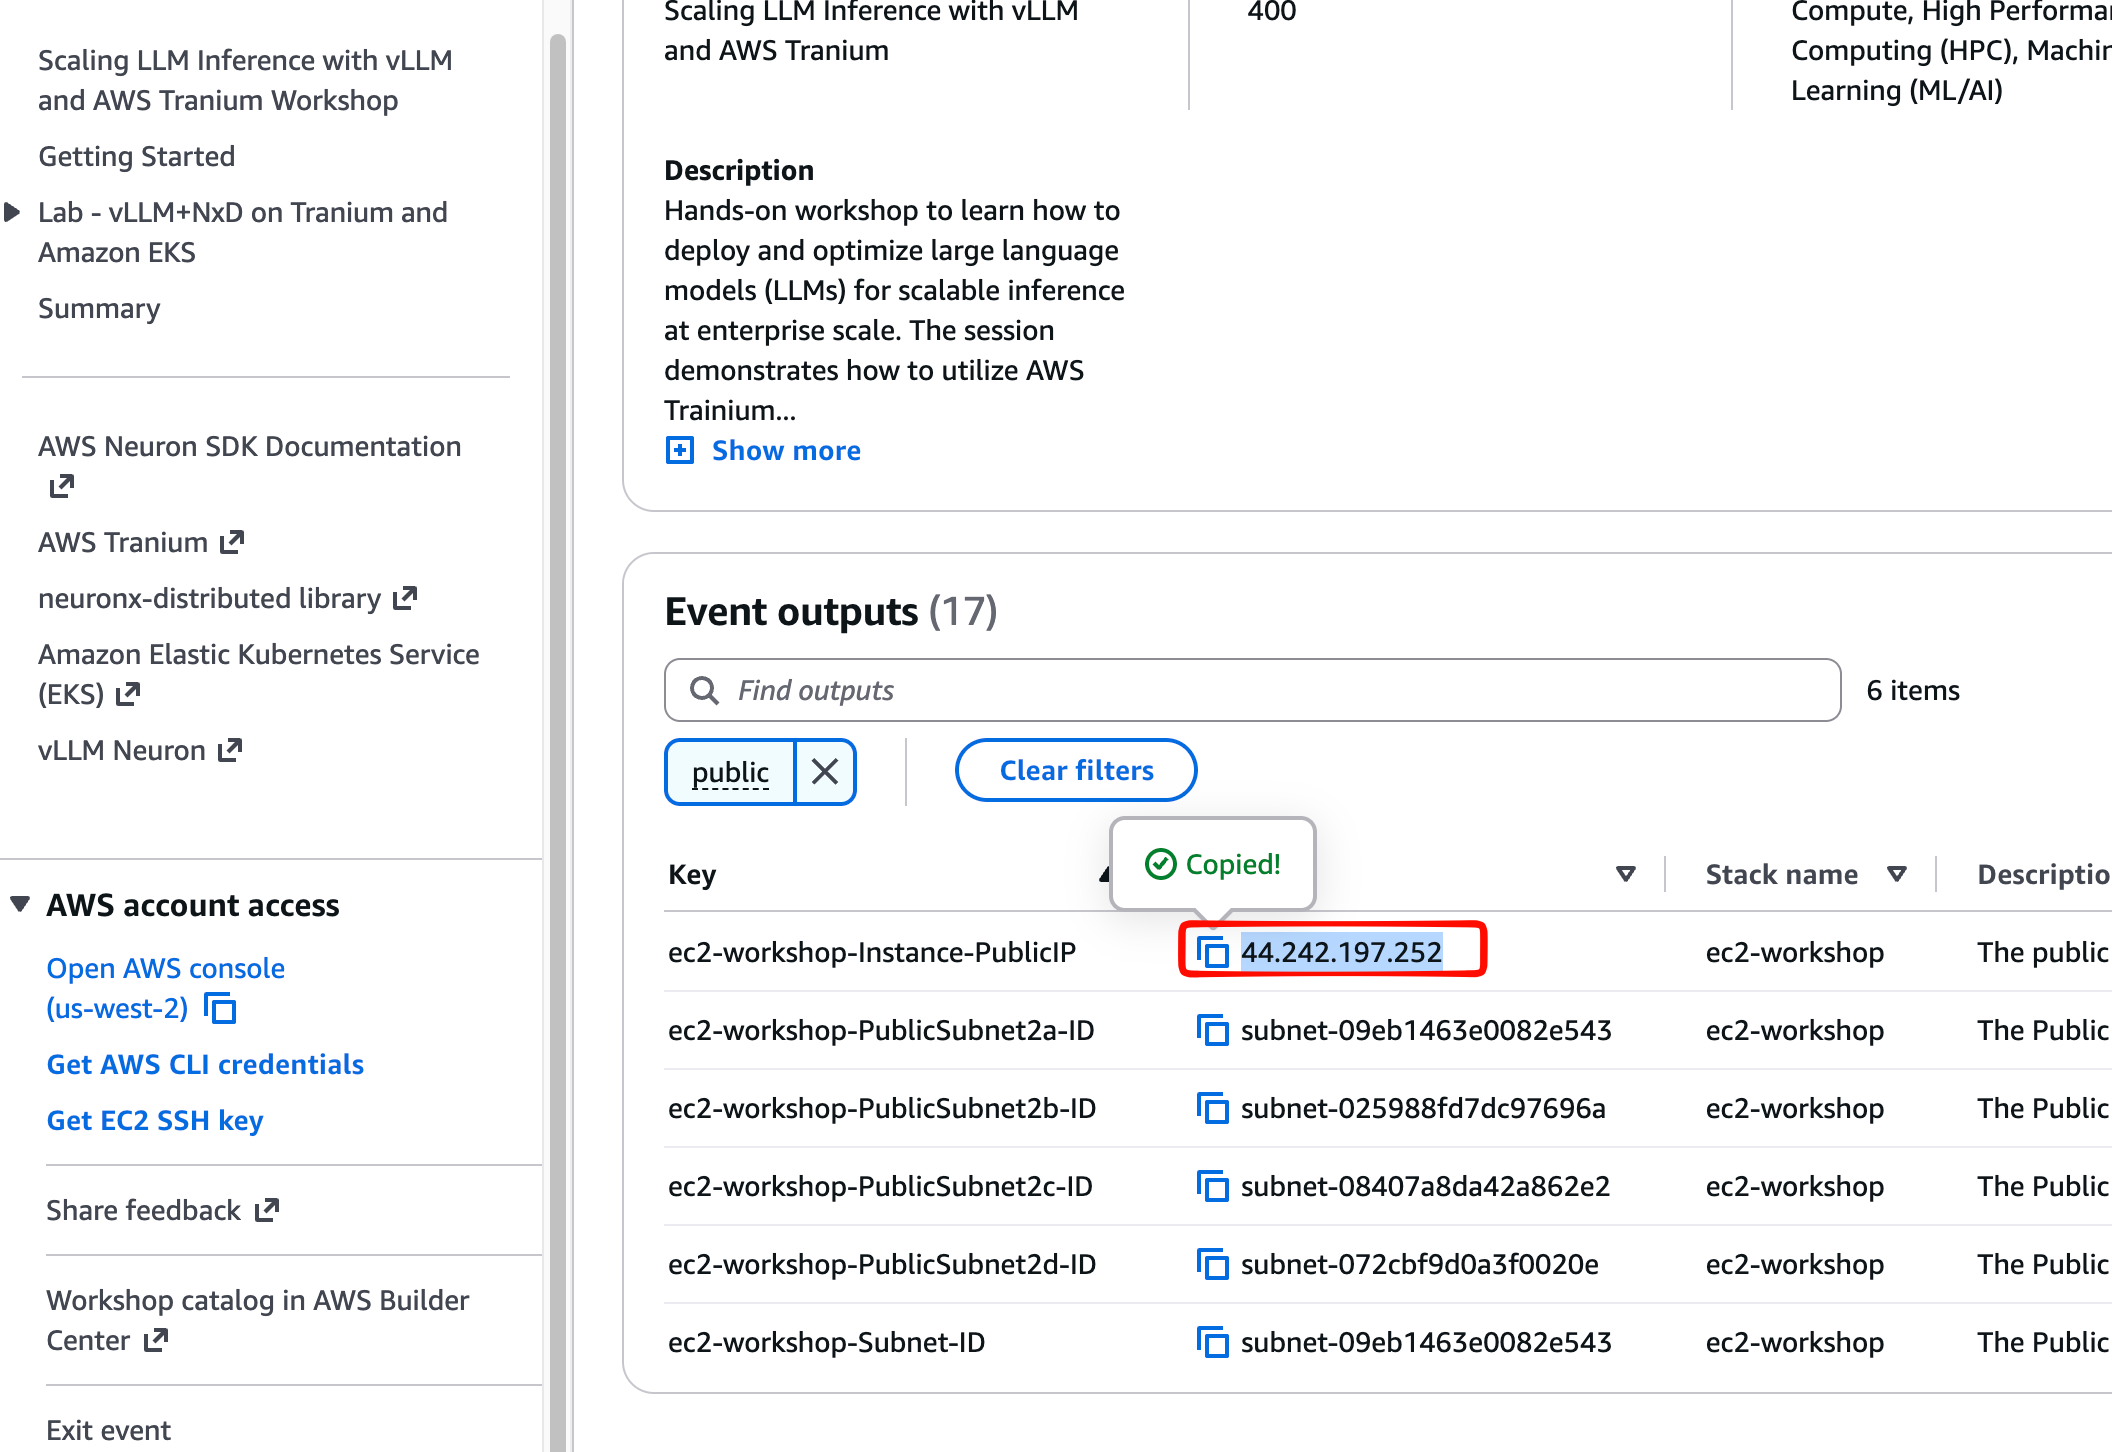
# workshop 계정에서 발급된 EC2에 접속한다
MYEC2IP=<EC2_PUBLIC_IP>
ssh -i ws-default-keypair.pem ubuntu@$MYEC2IP

#
whoami
hostnamectl
...
  Hardware Model: t3.2xlarge

htop
df -hT
ip -c addr
docker info

#
sudo apt update && sudo apt install tree jq -y
tree -a workshop/
workshop/
└── .env

cat workshop/.env
HF_TOKEN="hf_****************************"
Lab1: EKS Cluster Setup
작업은 모두 workshop EC2(t3.2xlarge, Ubuntu 22.04) 안에서 진행한다. EKS control plane은 workshop CloudFormation stack이 미리 생성해 둔 상태이며, 여기서는 Trainium node group 추가 → Neuron device plugin → model cache용 S3 연결 순서로 붙인다.
1. 도구 설치
cd workshop
pwd

# Update package list and install tools
sudo apt update
sudo apt install -y python3-pip jq unzip

# Install AWS CLI v2
curl "https://awscli.amazonaws.com/awscli-exe-linux-x86_64.zip" -o "awscliv2.zip"
unzip awscliv2.zip
sudo ./aws/install --update

# Install Helm
curl https://raw.githubusercontent.com/helm/helm/main/scripts/get-helm-3 | bash

# Enable kubectl autocompletion for current session and add to bashrc
source <(kubectl completion bash) && echo "source <(kubectl completion bash)" >> ~/.bashrc

# Verify installations
aws --version
helm version --short
jq --version
설치 결과는 다음과 같다. kubectl과 eksctl은 AMI에 이미 포함되어 있다.
$ aws --version
aws-cli/2.36.43 Python/3.14.6 Linux/6.8.0-1035-aws exe/x86_64.ubuntu.22

$ helm version --short
v3.22.0+g144ca65

$ eksctl version
0.230.0

$ kubectl version --client
Client Version: v1.37.0
Kustomize Version: v5.8.1
2. 환경 변수 설정
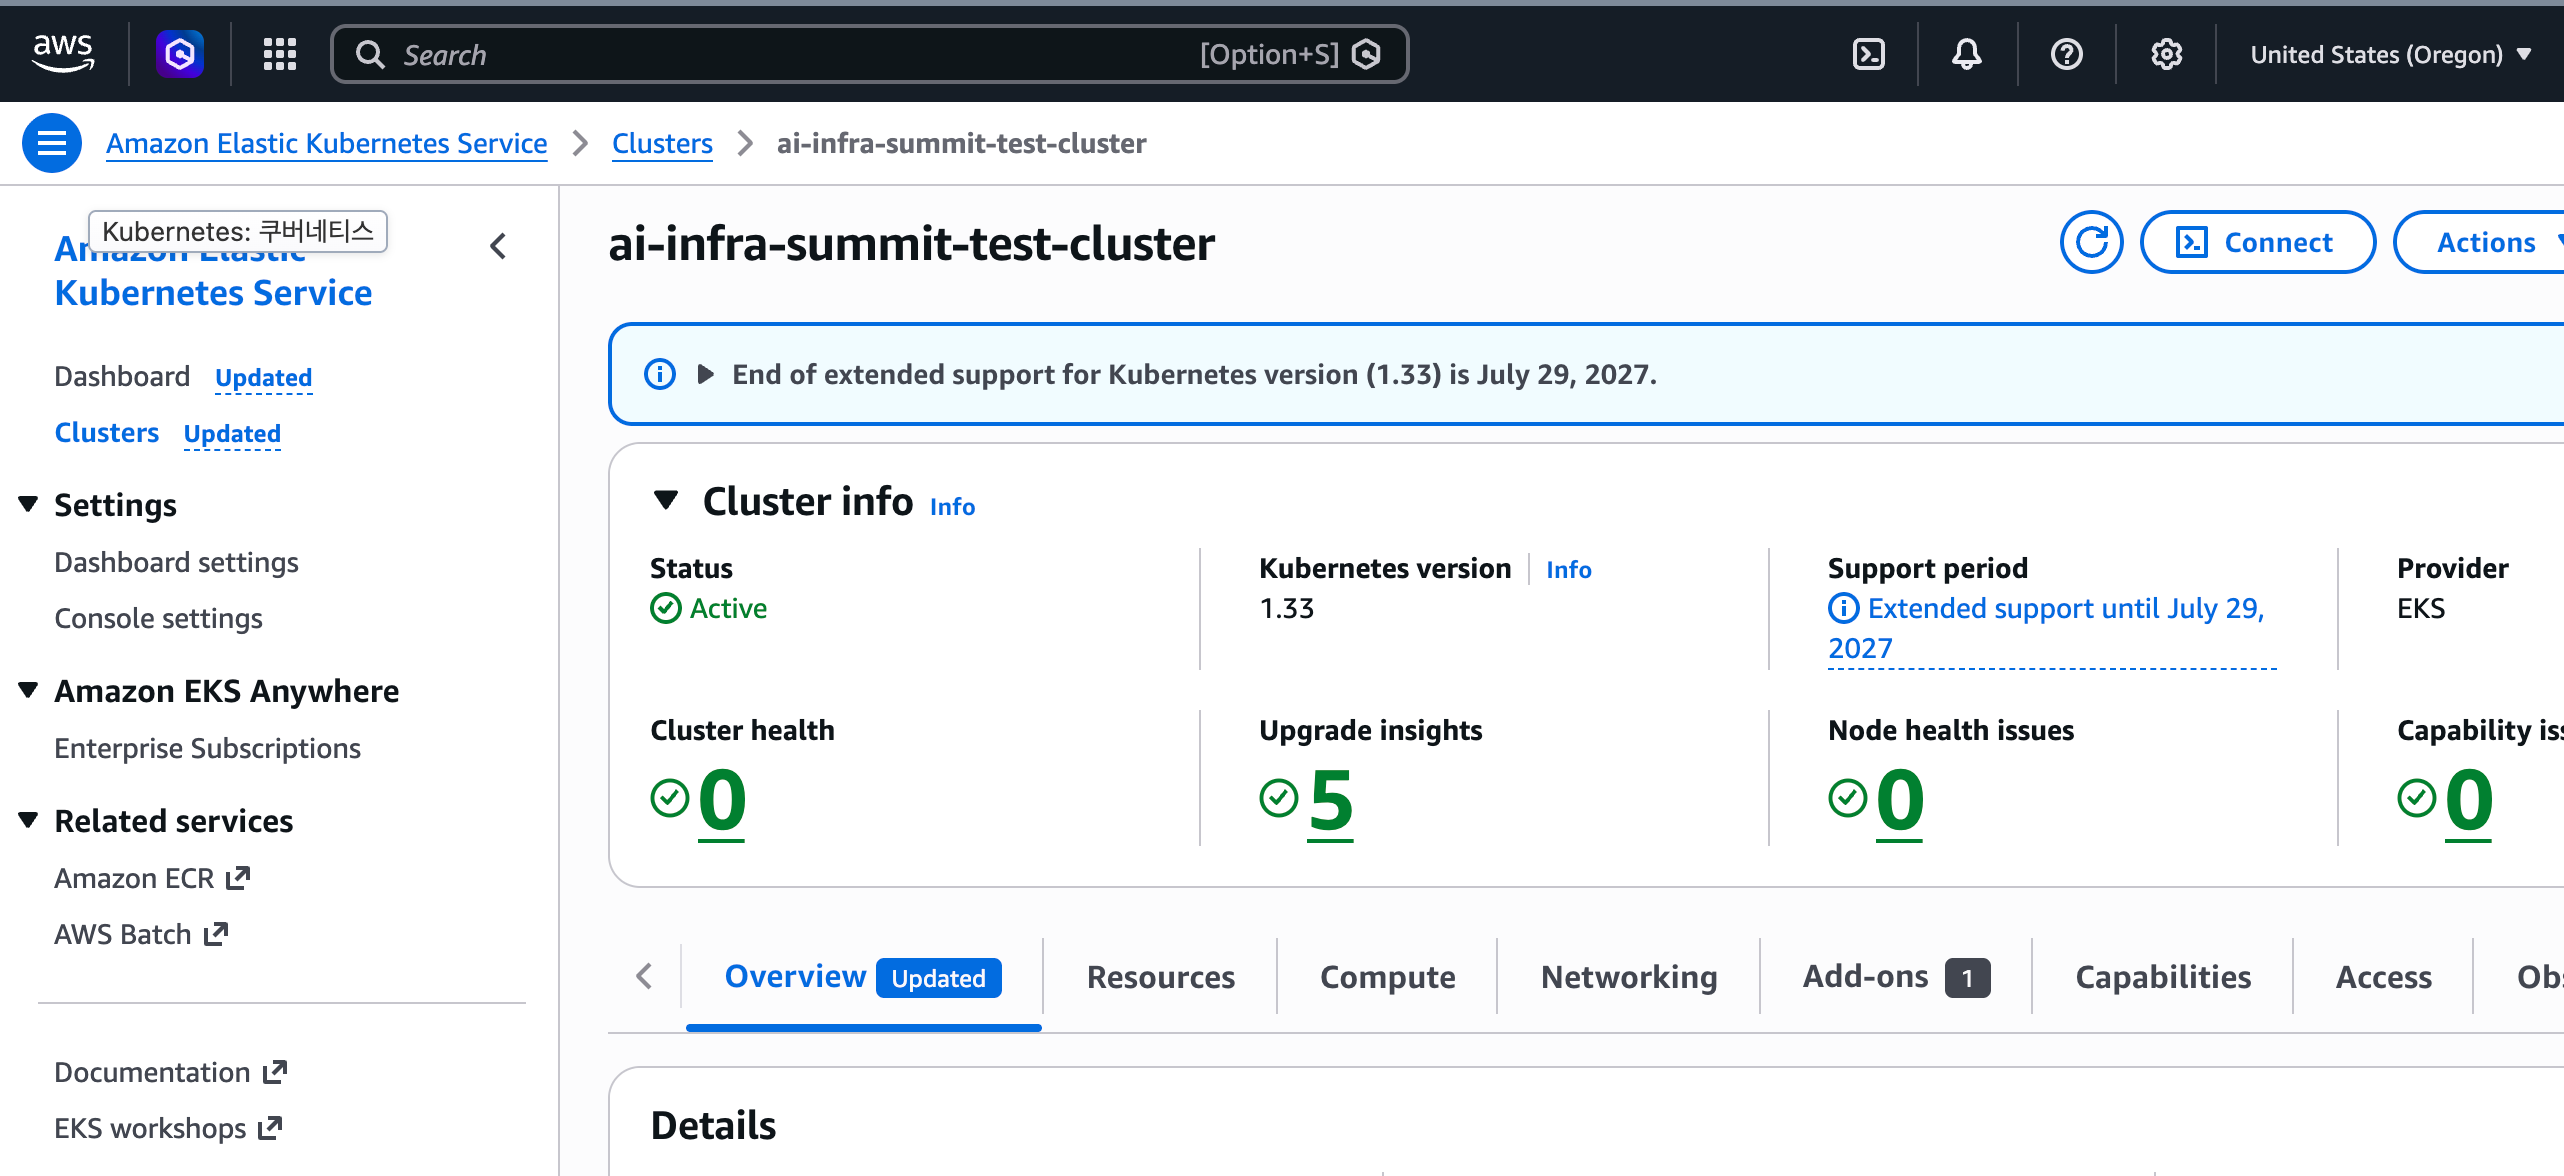
node group에 쓸 AMI는 직접 찾지 않고 SSM public parameter에서 가져온다. Trainium/Inferentia용 EKS optimized AMI는 .../amazon-linux-2023/x86_64/neuron/recommended/image_id 경로에 있다.
export AWS_REGION=us-west-2
export CLUSTER_NAME=ai-infra-summit-test-cluster
export EKS_VERSION=1.33
export INSTANCE_TYPE=trn1.2xlarge
export DESIRED_NODES=1
export WORKER_AMI=$(aws ssm get-parameter \
    --name /aws/service/eks/optimized-ami/1.33/amazon-linux-2023/x86_64/neuron/recommended/image_id \
    --region $AWS_REGION \
    --query "Parameter.Value" \
    --output text)
export AWS_ACCOUNT_ID=$(aws sts get-caller-identity --query Account --output text)
export BUCKET_NAME=ai-infra-summit-vllm-models-cache-${AWS_ACCOUNT_ID}

echo "$CLUSTER_NAME $WORKER_AMI $AWS_ACCOUNT_ID $BUCKET_NAME"ai-infra-summit-test-cluster ami-0e08c07b0376ba3f8 <ACCOUNT_ID> ai-infra-summit-vllm-models-cache-<ACCOUNT_ID>EC2에는 instance profile이 붙어 있어 별도 credential 설정이 필요 없다.
$ aws sts get-caller-identity
{
    "UserId": "<ROLE_ID>:<EC2_INSTANCE_ID>",
    "Account": "<ACCOUNT_ID>",
    "Arn": "arn:aws:sts::<ACCOUNT_ID>:assumed-role/ec2-workshop-WorkshopInstanceRole-MXbUd3DpMGVq/<EC2_INSTANCE_ID>"
}
3. kubeconfig 설정
aws eks update-kubeconfig --region $AWS_REGION --name $CLUSTER_NAMEUpdated context arn:aws:eks:us-west-2:<ACCOUNT_ID>:cluster/ai-infra-summit-test-cluster in /home/ubuntu/.kube/configcluster 상태를 확인한다. control plane은 이미 ACTIVE이고 endpoint는 private access만 열려 있다. workshop EC2가 같은 VPC 안에 있어 접근이 된다.
$ aws eks describe-cluster --name $CLUSTER_NAME --region $AWS_REGION \
    --query "cluster.{status:status,version:version,createdAt:createdAt,vpc:resourcesVpcConfig.vpcId}"
{
    "status": "ACTIVE",
    "version": "1.33",
    "createdAt": "2026-09-11T03:55:40.647000+00:00",
    "vpc": "<VPC_ID>"
}
이 시점에는 node가 하나도 없고 coredns만 pending 상태로 떠 있다.
4. Trainium node group 생성
VPC / subnet 확인
node group 정의에 넣을 VPC, subnet, security group ID를 cluster에서 그대로 가져온다.
aws eks describe-cluster --name $CLUSTER_NAME --region $AWS_REGION \
--query "cluster.resourcesVpcConfig"{
"subnetIds": [
"<SUBNET-2A-PUBLIC>",
"<SUBNET-2B-PUBLIC>",
"<SUBNET-2C-PUBLIC>",
"<SUBNET-2D-PUBLIC>",
"<SUBNET-2A-PRIVATE>",
"<SUBNET-2B-PRIVATE>",
"<SUBNET-2C-PRIVATE>",
"<SUBNET-2D-PRIVATE>"
],
"securityGroupIds": [],
"clusterSecurityGroupId": "<CLUSTER-SG>",
"vpcId": "<VPC_ID>",
"endpointPublicAccess": false,
"endpointPrivateAccess": true,
"publicAccessCidrs": [],
"controlPlaneEgressMode": "AWS_MANAGED"
}subnet이 8개라 어느 것이 public인지 구분이 필요하다. trn1.2xlarge는 특정 AZ에만 있으므로 public subnet 중 us-west-2b, us-west-2d를 고른다.
aws ec2 describe-subnets --region $AWS_REGION \
    --filters "Name=vpc-id,Values=<VPC_ID>" \
    --query "Subnets[].{id:SubnetId,az:AvailabilityZone,cidr:CidrBlock,public:MapPublicIpOnLaunch}" \
--output table----------------------------------------------------------------
| DescribeSubnets |
+------------+--------------+-----------------------+----------+
| az | cidr | id | public |
+------------+--------------+-----------------------+----------+
| us-west-2b| 10.0.7.0/24 | <SUBNET-2B-PRIVATE> | False |
| us-west-2b| 10.0.5.0/24 | <SUBNET-2B-PUBLIC> | True |
| us-west-2c| 10.0.8.0/24 | <SUBNET-2C-PRIVATE> | False |
| us-west-2a| 10.0.3.0/24 | <SUBNET-2A-PRIVATE> | False |
| us-west-2a| 10.0.1.0/24 | <SUBNET-2A-PUBLIC> | True |
| us-west-2d| 10.0.2.0/24 | <SUBNET-2D-PUBLIC> | True |
| us-west-2d| 10.0.4.0/24 | <SUBNET-2D-PRIVATE> | False |
| us-west-2c| 10.0.6.0/24 | <SUBNET-2C-PUBLIC> | True |
+------------+--------------+-----------------------+----------+SSH key 생성
node group에 SSH 접근을 열어 두려면 public key가 필요하다.
ssh-keygen -t rsa -b 3072 -f ~/.ssh/id_rsa -N ""node group manifest
eksctl의 ClusterConfig로 managed node group만 추가한다. cluster는 이미 있으므로 metadata의 이름과 region이 기존 cluster와 일치해야 한다.
apiVersion: eksctl.io/v1alpha5
kind: ClusterConfig
metadata:
  name: ai-infra-summit-test-cluster
  region: us-west-2
  version: "1.33"
vpc:
  id: <VPC_ID>
  subnets:
    public:
      us-west-2b: { id: <SUBNET-2B-PUBLIC> }
      us-west-2d: { id: <SUBNET-2D-PUBLIC> }
  securityGroup: <CLUSTER-SG>
managedNodeGroups:
- name: neuron-trn1-2x
  ami: ami-0e08c07b0376ba3f8
  amiFamily: AmazonLinux2023
  subnets: ["<SUBNET-2B-PUBLIC>", "<SUBNET-2D-PUBLIC>"]
  iam:
    attachPolicyARNs:
    - arn:aws:iam::aws:policy/AmazonEKSWorkerNodePolicy
    - arn:aws:iam::aws:policy/AmazonEC2ContainerRegistryReadOnly
    - arn:aws:iam::aws:policy/AmazonSSMManagedInstanceCore
    - arn:aws:iam::aws:policy/AmazonS3FullAccess
    - arn:aws:iam::aws:policy/AmazonEKS_CNI_Policy
  instanceType: trn1.2xlarge
  desiredCapacity: 1
  volumeSize: 100
  volumeType: gp2
  ssh:
     allow: true
publicKeyPath: ~/.ssh/id_rsa.pubami를 직접 지정하면 amiFamily도 같이 명시해야 한다. node IAM role에 AmazonS3FullAccess를 붙이는 이유는 뒤에서 Mountpoint S3 CSI driver가 node role 권한으로 bucket에 접근하기 때문이다.
생성
eksctl create nodegroup -f eks_nodegroup.yamlCloudFormation stack eksctl-ai-infra-summit-test-cluster-nodegroup-neuron-trn1-2x가 만들어지고, 약 5분 뒤 node 한 대가 붙는다.
$ eksctl get nodegroup --cluster $CLUSTER_NAME --region $AWS_REGION
CLUSTER                       NODEGROUP       STATUS  CREATED               MIN SIZE  MAX SIZE  DESIRED CAPACITY  INSTANCE TYPE  IMAGE ID               TYPE
ai-infra-summit-test-cluster neuron-trn1-2x ACTIVE 2026-09-11T13:47:03Z 1 1 1 trn1.2xlarge ami-0e08c07b0376ba3f8 managed$ kubectl get nodes -o wide
NAME STATUS ROLES AGE VERSION INTERNAL-IP EXTERNAL-IP OS-IMAGE KERNEL-VERSION CONTAINER-RUNTIME
ip-10-0-5-142.us-west-2.compute.internal Ready <none> 11m v1.33.13-eks-cb19647 10.0.5.142 34.222.123.83 Amazon Linux 2023.12.20260831 6.12.103-127.188.amzn2023.x86_64 containerd://2.2.5+unknown5. Neuron device plugin / scheduler 설치
node가 Ready여도 Trainium device는 아직 Kubernetes에 노출되지 않는다. aws.amazon.com/neuron resource를 광고하려면 Neuron device plugin이 필요하다. chart는 OCI registry(public.ecr.aws)에서 바로 받는다.
helm install neuron-helm-chart oci://public.ecr.aws/neuron/neuron-helm-chart \
--set "npd.enabled=false"trn1.2xlarge는 Neuron device가 1개(NeuronCore 2개)뿐이라 기본 scheduler로도 동작하지만, 여러 device를 쓰는 multi-card 배치에서는 연속된 core를 할당하는 Neuron scheduler extension이 필요하다. 이어서 scheduler를 켠다.
helm upgrade neuron-helm-chart oci://public.ecr.aws/neuron/neuron-helm-chart \
  --set "npd.enabled=false" \
--set "scheduler.enabled=true"$ helm history neuron-helm-chart -n default
REVISION UPDATED STATUS CHART APP VERSION DESCRIPTION
1 Fri Sep 11 13:56:32 2026 superseded neuron-helm-chart-1.10.0 1.10.0 Install complete
2 Fri Sep 11 13:56:53 2026 deployed neuron-helm-chart-1.10.0 1.10.0 Upgrade complete
$ helm get values neuron-helm-chart -n default
USER-SUPPLIED VALUES:
npd:
enabled: false
scheduler:
enabled: truedevice plugin(DaemonSet), Neuron scheduler extension, 그리고 extension을 물고 있는 보조 scheduler(my-scheduler)가 올라온다.
$ kubectl get pods -n kube-system | grep -E "neuron|scheduler"
k8s-neuron-scheduler-785c8d99f8-zbrt6   1/1     Running   0   2m23s
my-scheduler-55f56bc9f8-25m4c           1/1     Running   0   2m23s
neuron-device-plugin-vl2jb              1/1     Running   0   2m45s
node의 allocatable resource에 Neuron이 잡히면 정상이다.
$ kubectl get node -o json | jq -r '.items[] | .status.allocatable'
{
  "aws.amazon.com/neuron": "1",
  "aws.amazon.com/neuroncore": "2",
  "cpu": "7910m",
  "ephemeral-storage": "95491281146",
  "hugepages-1Gi": "0",
  "hugepages-2Mi": "0",
  "memory": "31315408Ki",
  "pods": "58"
}
trn1.2xlarge 한 대는 Trainium chip 1개 = NeuronCore 2개다. vCPU 8개 중 7910m이 allocatable로 남는다.
6. Model cache용 S3 + Mountpoint S3 CSI driver
vLLM이 매번 Hugging Face에서 모델을 내려받고 Neuron compile을 다시 하면 시간이 오래 걸린다. 컴파일 결과와 weight를 S3에 캐시하고 Pod에 volume으로 붙이기 위해 bucket과 CSI driver를 준비한다.
aws s3 mb s3://${BUCKET_NAME} --region $AWS_REGION
aws s3 ls2026-09-11 13:56:09 ai-infra-summit-vllm-models-cache-<ACCOUNT_ID>CSI driver는 Helm repository에서 설치한다.
helm repo add aws-mountpoint-s3-csi-driver https://awslabs.github.io/mountpoint-s3-csi-driver
helm repo update
helm upgrade --install aws-mountpoint-s3-csi-driver \
  aws-mountpoint-s3-csi-driver/aws-mountpoint-s3-csi-driver \
  --namespace kube-system
IRSA를 따로 만들지 않았으므로 s3-csi-driver-sa에는 role annotation이 없다. node group IAM role에 붙여 둔 AmazonS3FullAccess로 bucket에 접근한다.
$ kubectl get pods -n kube-system | grep s3-csi
s3-csi-controller-5df587766f-dqb2z   1/1     Running   0   2m
s3-csi-node-5b6lt                    3/3     Running   0   2m
7. 최종 상태 확인
$ helm list -A
NAME                          NAMESPACE    REVISION  STATUS    CHART                               APP VERSION
aws-mountpoint-s3-csi-driver  kube-system  1         deployed  aws-mountpoint-s3-csi-driver-2.8.0
neuron-helm-chart             default      2         deployed  neuron-helm-chart-1.10.0            1.10.0

$ kubectl get pods -A
NAMESPACE     NAME                                    READY   STATUS    RESTARTS   AGE
kube-system   aws-node-hkdj6                          2/2     Running   0          11m
kube-system   coredns-75cb89d95b-lf4lz                1/1     Running   0          9h
kube-system   coredns-75cb89d95b-v5rzs                1/1     Running   0          9h
kube-system   k8s-neuron-scheduler-785c8d99f8-zbrt6   1/1     Running   0          2m23s
kube-system   kube-proxy-jtwxj                        1/1     Running   0          11m
kube-system   my-scheduler-55f56bc9f8-25m4c           1/1     Running   0          2m23s
kube-system   neuron-device-plugin-vl2jb              1/1     Running   0          2m45s
kube-system   s3-csi-controller-5df587766f-dqb2z      1/1     Running   0          2m
kube-system   s3-csi-node-5b6lt                       3/3     Running   0          2m
여기까지가 vLLM을 올리기 전 단계다. 정리하면 다음과 같다.
| 구성 요소 | 값 | 비고 |
|---|---|---|
| Cluster | ai-infra-summit-test-cluster (EKS 1.33, us-west-2) | control plane은 workshop CFN이 사전 생성, private endpoint |
| CNI | amazon-k8s-cni:v1.22.4-eksbuild.3 | VPC CNI |
| Node group | neuron-trn1-2x (managed, trn1.2xlarge × 1) | eksctl로 추가 |
| AMI | ami-0e08c07b0376ba3f8 | EKS optimized AL2023 Neuron |
| Node storage | gp2 100GB | ephemeral-storage capacity 104779756Ki |
| Neuron resource | aws.amazon.com/neuron: 1, aws.amazon.com/neuroncore: 2 | device plugin 2.32.0.0 |
| Neuron scheduler | k8s-neuron-scheduler + my-scheduler | scheduler.enabled=true로 추가 설치 |
| Model cache | s3://ai-infra-summit-vllm-models-cache-<ACCOUNT_ID> | Mountpoint S3 CSI driver 2.8.0 |
| Node IAM role | EKSWorkerNode, EKS_CNI, ECR ReadOnly, SSM, S3FullAccess | CSI driver가 이 권한으로 bucket 접근 |
| IRSA | 미사용 | cluster OIDC issuer는 있으나 IAM OIDC provider 미등록 |
두 가지는 워크숍 가이드 설명과 다르니 확인이 필요하다.
- node volume은 500GB가 아니라 100GB다.
eks_nodegroup.yaml의volumeSize: 100이 그대로 반영됐다. 모델을 로컬 디스크에 받는 구성이라면 부족할 수 있으나, 여기서는 S3에 캐시하므로 그대로 진행한다. - OIDC는 “enabled” 상태가 아니다. EKS cluster는 모두 OIDC issuer URL을 갖지만, IAM에 OIDC identity provider가 등록되지 않아 IRSA를 쓸 수 없다.
$ aws iam list-open-id-connect-providers
{
    "OpenIDConnectProviderList": []
}
그래서 s3-csi-driver-sa에 role annotation이 없고, node IAM role의 AmazonS3FullAccess로 S3에 접근한다. node group 정의에 S3 권한을 넣어 둔 이유가 이것이다.
참고: workshop role의 권한 제한
workshop EC2 role은 cluster 단위 조회 권한이 제한되어 있다. node group 조회는 되지만 cluster/addon 목록은 막혀 있으니 콘솔이나 describe-cluster로 확인한다.
$ eksctl get cluster --region us-west-2
Error: failed to list clusters in region "us-west-2": ... AccessDeniedException:
User: arn:aws:sts::<ACCOUNT_ID>:assumed-role/ec2-workshop-WorkshopInstanceRole-... is not
authorized to perform: eks:ListClusters ...
Lab2: vLLM Deployment
init container 패턴으로 vLLM을 배포한다. init container가 모델을 다운로드·컴파일해서 S3에 캐시하고, 메인 container는 컴파일된 아티팩트를 읽어 OpenAI 호환 API server를 띄운다. 컴파일 결과가 S3에 남으므로 재배포 시 컴파일 단계를 건너뛴다.
구성 요소는 여섯 가지다.
| 리소스 | 이름 | 역할 |
|---|---|---|
| Secret | hf-token-secret | Hugging Face 토큰 |
| ConfigMap | vllm-shared-config | 모델·Neuron 런타임 설정 |
| PV / PVC | s3-model-cache-pv / -pvc | S3 bucket을 RWX volume으로 마운트 |
| Deployment | vllm-deployment | init container + vLLM server |
| Service | vllm-service | Classic ELB로 외부 노출 |
1. HF_TOKEN Secret 생성
rm -rf /home/ubuntu/workshop/.env
echo 'HF_TOKEN="hf_****"' > /home/ubuntu/workshop/.env

source /home/ubuntu/workshop/.env
kubectl create secret generic hf-token-secret \
    --from-literal=HF_TOKEN="$HF_TOKEN" \
--dry-run=client -o yaml | kubectl apply -f -$ kubectl get secret hf-token-secret
NAME TYPE DATA AGE
hf-token-secret Opaque 1 40m--dry-run=client -o yaml | kubectl apply -f - 조합을 쓰면 Secret이 이미 있어도 AlreadyExists 없이 갱신된다.
2. ConfigMap 생성
vLLM과 Neuron 런타임 설정을 한곳에 모은다.
cat > vllm-configmap.yaml <<EOF
apiVersion: v1
kind: ConfigMap
metadata:
  name: vllm-shared-config
data:
  HF_TOKEN: "$HF_TOKEN"
  MODEL_NAME: "tinyLlama/TinyLlama-1.1B-Chat-v1.0"
  S3_BUCKET: "ai-infra-summit-vllm-models-cache-$(aws sts get-caller-identity | jq -r .Account)"
  S3_PREFIX: "compiled-models"
  MAX_NUM_SEQS: "4"
  PORT: "8080"
  NEURON_COMPILED_ARTIFACTS: "/shared/model/cache"
  NEURON_COMPILE_CACHE_URL: "/shared/model/cache"
  TENSOR_PARALLEL_SIZE: "2"
  MAX_MODEL_LEN: "1024"
  NEURON_RT_VISIBLE_CORES: "0-1"
  NEURON_RT_LOG_LEVEL: "ERROR"
  NEURON_RT_ASYNC_EXEC_MAX_INFLIGHT_REQUESTS: "4"
  VLLM_NEURON_FRAMEWORK: "neuronx-distributed-inference"
EOF
kubectl apply -f vllm-configmap.yaml
실제로 적용된 값은 다음과 같다(HF_TOKEN 제외, 14개 중 13개).
{
  "MAX_MODEL_LEN": "1024",
  "MAX_NUM_SEQS": "4",
  "MODEL_NAME": "tinyLlama/TinyLlama-1.1B-Chat-v1.0",
  "NEURON_COMPILED_ARTIFACTS": "/shared/model/cache",
  "NEURON_COMPILE_CACHE_URL": "/shared/model/cache",
  "NEURON_RT_ASYNC_EXEC_MAX_INFLIGHT_REQUESTS": "4",
  "NEURON_RT_LOG_LEVEL": "ERROR",
  "NEURON_RT_VISIBLE_CORES": "0-1",
  "PORT": "8080",
  "S3_BUCKET": "ai-infra-summit-vllm-models-cache-<ACCOUNT_ID>",
  "S3_PREFIX": "compiled-models",
  "TENSOR_PARALLEL_SIZE": "2",
  "VLLM_NEURON_FRAMEWORK": "neuronx-distributed-inference"
}
주요 설정의 의미는 다음과 같다.
| 키 | 값 | 의미 |
|---|---|---|
TENSOR_PARALLEL_SIZE | 2 | 가중치를 NeuronCore 2개에 분할. trn1.2xlarge의 코어를 모두 사용 |
NEURON_RT_VISIBLE_CORES | 0-1 | 런타임에 노출할 코어 인덱스 |
MAX_MODEL_LEN | 1024 | prompt+생성 최대 토큰. KV cache 크기 산정 기준 |
MAX_NUM_SEQS | 4 | continuous batching 동시 처리 시퀀스 상한 |
NEURON_COMPILE_CACHE_URL | /shared/model/cache | 컴파일 캐시 경로. S3 PVC 마운트 지점과 동일 |
VLLM_NEURON_FRAMEWORK | neuronx-distributed-inference | Neuron 백엔드로 NxD 추론 프레임워크 사용 |
두 가지는 짚고 넘어갈 만하다.
HF_TOKEN이 ConfigMap에 평문으로 들어간다. Secret을 따로 만든 의미가 없어진다. Deployment가secretRef로도 주입받으므로 ConfigMap 쪽HF_TOKEN은 빼도 동작한다.S3_PREFIX: compiled-models는 실제로 쓰이지 않는다. 아티팩트는 bucket 루트의cache/아래에 떨어진다(뒤의 S3 목록 참고). init container가cp -r /tmp/cache/* /shared/model/cache/로 복사하는데, PVC가 bucket 루트에 마운트되기 때문이다.
3. S3 PV / PVC 생성
cat > vllm-storage.yaml <<EOF
apiVersion: v1
kind: PersistentVolume
metadata:
  name: s3-model-cache-pv
spec:
  capacity:
    storage: 100Gi
  accessModes:
    - ReadWriteMany
  persistentVolumeReclaimPolicy: Retain
  csi:
    driver: s3.csi.aws.com
    volumeHandle: ai-infra-summit-vllm-models-cache-$(aws sts get-caller-identity | jq -r .Account)
    volumeAttributes:
      bucketName: ai-infra-summit-vllm-models-cache-$(aws sts get-caller-identity | jq -r .Account)
---
apiVersion: v1
kind: PersistentVolumeClaim
metadata:
  name: s3-model-cache-pvc
spec:
  accessModes:
    - ReadWriteMany
  resources:
    requests:
      storage: 100Gi
  volumeName: s3-model-cache-pv
EOF
kubectl apply -f vllm-storage.yaml$ kubectl get pvc,pv
NAME STATUS VOLUME CAPACITY ACCESS MODES RECLAIM POLICY AGE
persistentvolumeclaim/s3-model-cache-pvc Bound s3-model-cache-pv 100Gi RWX 39m
NAME CAPACITY ACCESS MODES RECLAIM POLICY STATUS CLAIM AGE
persistentvolume/s3-model-cache-pv 100Gi RWX Retain Bound default/s3-model-cache-pvc 39mstorageClassName이 비어 있는 static provisioning이다. capacity: 100Gi는 스케줄링용 논리값일 뿐이고 Mountpoint가 쿼터를 강제하지 않는다.
4. Deployment 배포
node에 붙은 label을 먼저 확인한다. nodeSelector가 이 label을 참조한다.
$ kubectl describe node | grep nodegroup-name
                    alpha.eksctl.io/nodegroup-name=neuron-trn1-2x
Deployment의 핵심은 세 가지다.
schedulerName: my-scheduler— Neuron scheduler extension을 통해 스케줄링initContainers.model-prep— 캐시 확인 → 없으면 다운로드·컴파일 →/shared/model/cache로 복사resources에aws.amazon.com/neuron: 1— device plugin이 광고한 Neuron device 1개 요청
spec:
  schedulerName: my-scheduler
  nodeSelector:
    alpha.eksctl.io/nodegroup-name: neuron-trn1-2x
  volumes:
    - name: model-storage
      persistentVolumeClaim:
        claimName: s3-model-cache-pvc
  initContainers:
    - name: model-prep
      image: public.ecr.aws/neuron/pytorch-inference-vllm-neuronx:0.9.1-neuronx-py310-sdk2.25.0-ubuntu22.04
      envFrom:
        - configMapRef: { name: vllm-shared-config }
        - secretRef:    { name: hf-token-secret }
      resources:
        limits:   { aws.amazon.com/neuron: 1, ephemeral-storage: 50Gi }
        requests: { aws.amazon.com/neuron: 1, ephemeral-storage: 50Gi }
      volumeMounts:
        - name: model-storage
          mountPath: /shared/model
  containers:
    - name: vllm-server
      image: public.ecr.aws/neuron/pytorch-inference-vllm-neuronx:0.9.1-neuronx-py310-sdk2.25.0-ubuntu22.04
      ports:
        - containerPort: 8080
          name: http-vllm
      volumeMounts:
        - name: model-storage
          mountPath: /shared/model
          readOnly: true
      resources:
        limits:   { aws.amazon.com/neuron: 1, ephemeral-storage: 50Gi, cpu: "8000m" }
        requests: { aws.amazon.com/neuron: 1, ephemeral-storage: 50Gi, cpu: "4000m" }
init container가 /shared/model/cache가 비어 있을 때만 컴파일한다. 컴파일은 /tmp/cache에서 수행하고 끝난 뒤 통째로 복사하는데, Mountpoint S3가 append나 부분 쓰기를 지원하지 않기 때문이다.
kubectl apply -f vllm-deployment.yaml
kubectl get pod -l app.kubernetes.io/name=vllm-server -w$ kubectl get deployment vllm-deployment -o wide
NAME READY UP-TO-DATE AVAILABLE AGE CONTAINERS IMAGES
vllm-deployment 1/1 1 1 38m vllm-server public.ecr.aws/neuron/pytorch-inference-vllm-neuronx:0.9.1-...
$ kubectl get pods -l app.kubernetes.io/name=vllm-server -o wide
NAME READY STATUS RESTARTS AGE IP NODE
vllm-deployment-64597fb8cc-cfjqk 1/1 Running 0 38m 10.0.5.40 ip-10-0-5-142.us-west-2.compute.internal
$ kubectl get pod -l app.kubernetes.io/name=vllm-server \
-o jsonpath='{.items[0].spec.schedulerName}{"\n"}{.items[0].spec.nodeSelector}'
my-scheduler
{"alpha.eksctl.io/nodegroup-name":"neuron-trn1-2x"}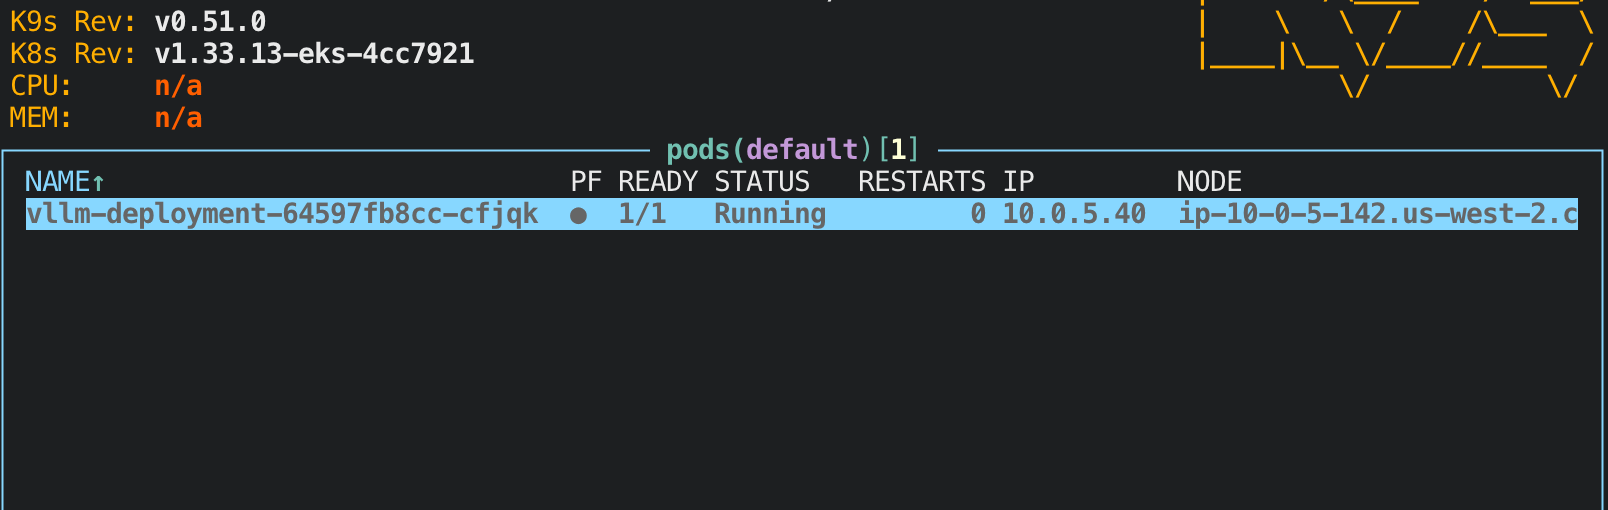
실측 소요 시간
Pod의 condition과 container 상태에서 각 구간을 뽑았다.
kubectl get pod -l app.kubernetes.io/name=vllm-server -o json | jq -r '.items[] |
{podCreated: .metadata.creationTimestamp,
 initStart:  .status.initContainerStatuses[0].state.terminated.startedAt,
 initFinish: .status.initContainerStatuses[0].state.terminated.finishedAt,
mainStart: .status.containerStatuses[0].state.running.startedAt}'| 구간 | 시각(UTC) | 소요 |
|---|---|---|
| Pod 생성 / 스케줄 | 14:16:32 | — |
| image pull 완료, init container 시작 | 14:19:24 | 2분 52초 |
| 모델 컴파일 + S3 업로드 완료 | 14:23:15 | 3분 51초 |
| vLLM server container 시작 | 14:23:16 | 1초 |
Application startup complete | 14:23:51 | 35초 |
| 전체 | 7분 19초 |
7.9GiB짜리 이미지를 받는 데 걸린 2분 52초와 컴파일 3분 51초가 대부분이다. 재배포 시에는 이미지가 node에 캐시돼 있고 S3에 컴파일 결과가 있으므로 마지막 35초 구간만 남는다.
init container 로그 끝부분에서 컴파일 완료를 확인할 수 있다.
$ kubectl logs -l app.kubernetes.io/name=vllm-server -c model-prep --tail=8
INFO:Neuron:Finished weights loading in 12.716184116000022 seconds
INFO:Neuron:Warming up the model.
INFO:Neuron:Warmup completed in 0.4222989082336426 seconds.
INFO 09-11 14:23:11 [executor_base.py:112] # neuron blocks: 4, # CPU blocks: 0
INFO 09-11 14:23:11 [executor_base.py:117] Maximum concurrency for 1024 tokens per request: 4.00x
INFO 09-11 14:23:11 [llm_engine.py:434] init engine (profile, create kv cache, warmup model) took 0.00 seconds
Model compiled successfully!
# neuron blocks: 4는 MAX_NUM_SEQS: 4에서 나온 값이고, 이것이 동시 처리 가능 요청 수 상한(4.00x)이 된다.
로그 중간에 나오는 libfabric 경고는 무시해도 된다. EFA 라이브러리가 없다는 메시지인데, 단일 node·단일 device 구성에서는 collective communication이 node 간을 넘지 않는다.
CCOM WARN NET/Plugin: Error: libnccom-net.so load failed. libfabric.so.1: cannot open shared object file5. S3 캐시 확인
$ aws s3 ls s3://$BUCKET_NAME --recursive --human-readable
2026-09-11 14:23:13    4.6 MiB cache/model.pt
2026-09-11 14:23:14    6.1 KiB cache/neuron_config.json
2026-09-11 14:23:14  359 Bytes cache/neuronxcc-2.20.9961.0+0acef03a/MODULE_56f0d314fda2b6e1e336+617f6939/compile_flags.json
2026-09-11 14:23:15    0 Bytes cache/neuronxcc-2.20.9961.0+0acef03a/MODULE_56f0d314fda2b6e1e336+617f6939/model.done
2026-09-11 14:23:14  547.2 KiB cache/neuronxcc-2.20.9961.0+0acef03a/MODULE_56f0d314fda2b6e1e336+617f6939/model.hlo_module.pb
2026-09-11 14:23:14    1.5 MiB cache/neuronxcc-2.20.9961.0+0acef03a/MODULE_56f0d314fda2b6e1e336+617f6939/model.neff
2026-09-11 14:23:15    1.6 MiB cache/neuronxcc-2.20.9961.0+0acef03a/MODULE_56f0d314fda2b6e1e336+617f6939/wrapped_neff.hlo
2026-09-11 14:23:15  359 Bytes cache/neuronxcc-2.20.9961.0+0acef03a/MODULE_ae92d68443828ba4e463+ad9e832d/compile_flags.json
2026-09-11 14:23:16    0 Bytes cache/neuronxcc-2.20.9961.0+0acef03a/MODULE_ae92d68443828ba4e463+ad9e832d/model.done
2026-09-11 14:23:15  851.5 KiB cache/neuronxcc-2.20.9961.0+0acef03a/MODULE_ae92d68443828ba4e463+ad9e832d/model.hlo_module.pb
2026-09-11 14:23:15  741.0 KiB cache/neuronxcc-2.20.9961.0+0acef03a/MODULE_ae92d68443828ba4e463+ad9e832d/model.neff

Total Objects: 11
   Total Size: 10320638
전체 10MB 남짓이다. 1.1B 모델의 가중치가 아니라 Neuron 컴파일 산출물만 올라간다. MODULE_ 디렉터리 두 개는 context encoding과 token generation 각각에 대한 컴파일 결과다.
| 파일 | 내용 |
|---|---|
model.neff | Neuron Executable File Format. 실제 device에서 실행되는 바이너리 |
model.hlo_module.pb | 컴파일러 입력인 HLO 그래프 |
compile_flags.json | 캐시 히트 판정에 쓰이는 컴파일 플래그 |
model.done | 컴파일 완료 마커(0 byte) |
Pod 안에서도 같은 트리가 보인다.
$ kubectl exec -it deploy/vllm-deployment -c vllm-server -- ls -R -1 /shared/model
/shared/model:
cache

/shared/model/cache:
model.pt
neuron_config.json
neuronxcc-2.20.9961.0+0acef03a

/shared/model/cache/neuronxcc-2.20.9961.0+0acef03a:
MODULE_56f0d314fda2b6e1e336+617f6939
MODULE_ae92d68443828ba4e463+ad9e832d
주입된 환경 변수도 확인한다.
$ kubectl exec -it deploy/vllm-deployment -c vllm-server -- env | grep -E 'NEURON|VLLM|MAX|TENSOR' | sort
MAX_MODEL_LEN=1024
MAX_NUM_SEQS=4
NEURON_COMPILED_ARTIFACTS=/shared/model/cache
NEURON_COMPILE_CACHE_URL=/shared/model/cache
NEURON_LOGICAL_NC_CONFIG=1
NEURON_RT_ASYNC_EXEC_MAX_INFLIGHT_REQUESTS=4
NEURON_RT_LOG_LEVEL=ERROR
NEURON_RT_VISIBLE_CORES=0-1
TENSOR_PARALLEL_SIZE=2
VLLM_NEURON_FRAMEWORK=neuronx-distributed-inference
VLLM_TARGET_DEVICE=neuronNEURON_LOGICAL_NC_CONFIG와 VLLM_TARGET_DEVICE는 ConfigMap에 없고 컨테이너 이미지가 기본으로 갖고 있는 값이다.
6. 워커노드에서 확인
workshop EC2의 security group egress가 53/80/443만 허용하므로 node에 SSH가 안 된다. kubectl debug로 node의 root filesystem에 들어간다.
kubectl debug node/ip-10-0-5-142.us-west-2.compute.internal -it \
  --image=public.ecr.aws/amazonlinux/amazonlinux:2023 --profile=sysadmin \
  -- chroot /host bash
컨테이너 이미지
$ ctr -n k8s.io images ls | grep -i vllm
public.ecr.aws/neuron/pytorch-inference-vllm-neuronx:0.9.1-neuronx-py310-sdk2.25.0-ubuntu22.04
public.ecr.aws/neuron/pytorch-inference-vllm-neuronx@sha256:01f0f7b1e2cf256019a80c16712e79a5f254b04a3a77dbf8ac196de4ee380928
프로세스
$ ps -ef | grep -E "mount-s3|api_server" | grep -v grep
ec2-user 14990 14969 0 14:16 ? 00:00:00 /mountpoint-s3/bin/mount-s3 ai-infra-summit-vllm-models-cache-<ACCOUNT_ID> /dev/fd/3 --allow-root --foreground --user-agent-prefix=s3-csi-driver/2.8.0 credential-source#driver k8s/v1.33.13-eks-4cc7921 md/install#helm
root 17827 15119 0 14:23 ? 00:00:09 python -m vllm.entrypoints.openai.api_server --model=tinyLlama/TinyLlama-1.1B-Chat-v1.0 --max-num-seqs=4 --max-model-len=1024 --tensor-parallel-size=2 --port=8080 --device=neuron --override-neuron-config={"enable_bucketing":false}mount-s3가 ec2-user 권한으로, vLLM이 root로 돈다. mount-s3는 14:16(볼륨 마운트 시점), vLLM은 14:23(init 완료 후)에 시작됐다.
S3 마운트
$ mount | grep -i s3
mountpoint-s3 on /var/lib/kubelet/plugins/s3.csi.aws.com/mnt/mp-8jfx5 type fuse (rw,nosuid,nodev,noatime,user_id=0,group_id=0,default_permissions,allow_other)
mountpoint-s3 on /var/lib/kubelet/pods/ea2412ea-.../volumes/kubernetes.io~csi/s3-model-cache-pv/mount type fuse (rw,nosuid,nodev,noatime,user_id=0,group_id=0,default_permissions,allow_other)
type fuse다. 블록 디바이스가 아니라 userspace FUSE filesystem이며, read/write syscall이 mount-s3 데몬으로 전달돼 S3 GetObject/PutObject/ListObjectsV2 호출로 변환된다.
일반 블록 스토리지 CSI는 “한 번 stage 후 bind mount로 재사용"하지만, S3 CSI driver는 마운트 지점마다 별도의 FUSE 프로세스를 띄운다. 위 두 항목이 bind mount 관계가 아닌 이유다.
Mountpoint의 성질 때문에 주의할 점이 있다.
- 용량 제한 없음 — PV의
100Gi는 스케줄링용 논리값이고 실제 쿼터는 강제되지 않는다. - 완전한 POSIX가 아님 — append, 부분 쓰기, hard link, 일부 rename이 제한된다. init container가
cp -r로 통째 복사하는 이유다. - 강한 읽기-후-쓰기 일관성 — 업로드 직후 다른 프로세스가 읽어도 최신 데이터가 보인다.
- 동시 접근 안전 — RWX로 여러 Pod가 붙어도 node/Pod마다 독립 FUSE 프로세스라 서로 영향이 없다.
Neuron device 점유
$ /opt/aws/neuron/bin/neuron-ls
instance-type: trn1.2xlarge
instance-id: <NODE_INSTANCE_ID>
+--------+--------+----------+--------+--------------+-------+----------+------+------------------------------------------+---------+
| NEURON | NEURON |  NEURON  | NEURON |     PCI      |  PID  |   CPU    | NUMA |                 COMMAND                  | RUNTIME |
| DEVICE | CORES  | CORE IDS | MEMORY |     BDF      |       | AFFINITY | NODE |                                          | VERSION |
+--------+--------+----------+--------+--------------+-------+----------+------+------------------------------------------+---------+
| 0      | 2      | 0-1      | 32 GB  | 0000:00:1e.0 | 17954 | 0-7      | -1   | /opt/conda/bin/python -c from multipr... | 2.27.23 |
+--------+--------+----------+--------+--------------+-------+----------+------+------------------------------------------+---------+
device 0의 코어 0-1을 vLLM 프로세스가 점유하고 있다. TENSOR_PARALLEL_SIZE: 2가 실제로 두 코어를 쓰고 있음을 확인할 수 있다. HBM은 32GB다.
7. LoadBalancer Service 생성
Service를 만들기 전에 Pod 안에서 API가 응답하는지 먼저 본다.
kubectl exec -it deploy/vllm-deployment -c vllm-server -- \
curl -s http://localhost:8080/v1/models | jq .datacat > vllm-service.yaml <<EOF
apiVersion: v1
kind: Service
metadata:
name: vllm-service
spec:
selector:
app.kubernetes.io/name: vllm-server
ports:
- protocol: TCP
port: 8080
targetPort: http-vllm
type: LoadBalancer
EOF
kubectl apply -f vllm-service.yaml$ kubectl get svc,ep vllm-service
NAME TYPE CLUSTER-IP EXTERNAL-IP PORT(S) AGE
service/vllm-service LoadBalancer 172.20.216.178 <VLLM-ELB> 8080:30732/TCP 13m
NAME ENDPOINTS AGE
endpoints/vllm-service 10.0.5.40:8080 13mannotation 없이 type: LoadBalancer만 주면 in-tree cloud provider가 Classic ELB를 만든다. 트래픽 경로는 ELB:8080 → nodePort 30732 → pod 10.0.5.40:8080이다.
controller가 ELB용 security group도 같이 만들고, node가 쓰는 cluster SG에 이 SG를 허용하는 규칙을 넣는다.
$ aws ec2 describe-security-groups --group-ids <ELB-SG> \
    --query "SecurityGroups[0].{name:GroupName,desc:Description}"
{
    "name": "k8s-elb-<VLLM-ELB-ID>",
    "desc": "Security group for Kubernetes ELB <VLLM-ELB-ID> (default/vllm-service)"
}
8. API 테스트
외부에서 직접 호출
export VLLM_ENDPOINT="http://<VLLM-ELB>:8080"

curl -s $VLLM_ENDPOINT/v1/models | jq .data[
{
"id": "tinyLlama/TinyLlama-1.1B-Chat-v1.0",
"object": "model",
"created": 1789138204,
"owned_by": "vllm",
"root": "tinyLlama/TinyLlama-1.1B-Chat-v1.0",
"parent": null,
"max_model_len": 1024
}
]curl -s $VLLM_ENDPOINT/v1/chat/completions \
-H "Content-Type: application/json" \
-d '{
"model": "tinyLlama/TinyLlama-1.1B-Chat-v1.0",
"messages": [{"role": "user", "content": "What is AWS Trainium in one sentence?"}],
"max_tokens": 80
}'{
"id": "chatcmpl-1f0fa6b77ee34cf298c48602bba5267b",
"model": "tinyLlama/TinyLlama-1.1B-Chat-v1.0",
"choices": [{
"index": 0,
"message": {
"role": "assistant",
"content": "AWS Trainium is an open-source, interactive website that provides demonstrations of Amazon Web Services (AWS) functionality and examples of successful deployments to help users better understand the capabilities and features of the platform."
},
"finish_reason": "stop"
}],
"usage": {"prompt_tokens": 25, "completion_tokens": 45, "total_tokens": 70}
}응답 내용 자체는 사실과 다르다. 1.1B 모델의 한계이며, 여기서 확인하는 것은 추론 경로가 동작하는지이지 답변 품질이 아니다.
workshop EC2에서 테스트할 때
EC2의 SG egress에 8080이 없어 ELB 주소로 직접 호출하면 timeout이 난다. port-forward로 우회한다.
kubectl port-forward svc/vllm-service 8080:8080 &
export VLLM_ENDPOINT="http://localhost:8080"
curl -s $VLLM_ENDPOINT/v1/models | jq .data
테스트가 끝나면 background job을 정리한다.
kill %1대화형 클라이언트
from openai import OpenAI
import sys, os

def main():
    base_endpoint = os.getenv("VLLM_ENDPOINT")
    if not base_endpoint:
        print("Error: VLLM_ENDPOINT environment variable is not set")
        sys.exit(1)

    client = OpenAI(api_key="EMPTY", base_url=f"{base_endpoint}/v1")
    model_name = client.models.list().data[0].id
    print(f"Connected! Using model: {model_name}")

    print("Chat (type 'exit' to quit):")
    while True:
        user_input = input("\nYou: ").strip()
        if user_input.lower() in ['exit', 'quit', 'bye'] or not user_input:
            break
        response = client.chat.completions.create(
            model=model_name,
            messages=[{"role": "user", "content": user_input}],
            max_tokens=900,
            temperature=1.0,
            extra_body={'top_k': 50})
        print("AI:", response.choices[0].message.content)

if __name__ == "__main__":
main()pip install openai
python3 test-vllm-pod.pyAPI key는 "EMPTY"를 넣는다. vLLM의 OpenAI 호환 server는 --api-key를 주지 않으면 인증을 하지 않는다.
디버깅에 쓴 명령어
# 컨트롤러 로그
kubectl logs -n kube-system -l name=neuron-device-plugin-ds
kubectl logs -n kube-system -l app.kubernetes.io/component=k8s-neuron-scheduler

# 이벤트 / 리소스 확인
kubectl get events --sort-by=.metadata.creationTimestamp
kubectl describe pods -l app.kubernetes.io/name=vllm-server | grep -A 10 "Requests"
kubectl describe nodes -l alpha.eksctl.io/nodegroup-name=neuron-trn1-2x

# 컨테이너별 로그
kubectl logs -l app.kubernetes.io/name=vllm-server -c model-prep -f
kubectl logs -l app.kubernetes.io/name=vllm-server -c vllm-server -f
Pod가 Pending에서 멈추면 aws.amazon.com/neuron allocatable이 0인 경우가 대부분이다. device plugin이 떴는지부터 확인한다.
Lab3: Ingress Configuration
NGINX Ingress Controller를 올리고, path 기반 라우팅으로 vLLM API를 외부에 노출한다.
vllm-service는 type: LoadBalancer라 Service 하나당 ELB가 하나씩 붙는다. 여러 서비스를 하나의 진입점에서 path나 host로 분기하려면 Ingress controller가 필요하다.
1. NGINX Ingress Controller 설치
echo "$AWS_REGION $CLUSTER_NAME"us-west-2 ai-infra-summit-test-cluster설치
# Add NGINX Ingress Controller Helm repository
helm repo add ingress-nginx https://kubernetes.github.io/ingress-nginx

# Install NGINX Ingress Controller
helm upgrade --install ingress-nginx ingress-nginx \
  --repo https://kubernetes.github.io/ingress-nginx \
  --namespace ingress-nginx \
  --create-namespace

# Wait for the ingress controller to be ready
kubectl wait --namespace ingress-nginx \
  --for=condition=ready pod \
  --selector=app.kubernetes.io/component=controller \
--timeout=90s"ingress-nginx" has been added to your repositories
...
pod/ingress-nginx-controller-6797f4dc8c-7cqcq condition met--repo 플래그를 직접 주므로 앞의 helm repo add는 이 명령만 놓고 보면 없어도 된다. 나중에 helm search repo로 차트를 찾으려면 등록해 두는 편이 편하다.
kubectl wait는 18초 만에 통과했다.
설치 확인
$ helm list -n ingress-nginx
NAME           NAMESPACE      REVISION  UPDATED                                 STATUS    CHART                 APP VERSION
ingress-nginx  ingress-nginx  1         2026-09-11 15:09:53.621833545 +0000 UTC deployed  ingress-nginx-4.15.1  1.15.1

$ kubectl get pod -n ingress-nginx -o wide
NAME                                        READY   STATUS    RESTARTS   AGE   IP           NODE
ingress-nginx-controller-6797f4dc8c-7cqcq   1/1     Running   0          18s   10.0.5.252   ip-10-0-5-142.us-west-2.compute.internal

$ kubectl get svc,ep -n ingress-nginx ingress-nginx-controller
NAME                               TYPE           CLUSTER-IP       EXTERNAL-IP                                                               PORT(S)                      AGE
service/ingress-nginx-controller   LoadBalancer   172.20.238.179   <INGRESS-ELB>   80:30381/TCP,443:32447/TCP   19s

NAME                                 ENDPOINTS                      AGE
endpoints/ingress-nginx-controller   10.0.5.252:443,10.0.5.252:80   19s
controller Pod는 vLLM과 같은 node(ip-10-0-5-142)에 떴다. 이 클러스터의 워커노드가 한 대뿐이라 선택지가 없다.
IngressClass도 함께 생성된다. Ingress 리소스에서 ingressClassName: nginx로 참조한다.
$ kubectl get ingressclass
NAME    CONTROLLER             PARAMETERS   AGE
nginx   k8s.io/ingress-nginx   <none>       20s
controller 단독 동작 확인
controller Service도 type: LoadBalancer라 두 번째 Classic ELB가 생성된다. 80/443을 받아 nodePort 30381 / 32447로 넘긴다.
ELB가 backend 등록을 마치는 데 생성 직후 1~2분이 걸린다. 그 전에는 연결이 그냥 끊긴다.
$ curl -i http://<INGRESS-ELB>/
HTTP/1.1 404 Not Found
Date: Fri, 11 Sep 2026 15:11:52 GMT
Content-Type: text/html
Content-Length: 146
Connection: keep-alive

<html>
<head><title>404 Not Found</title></head>
<body>
<center><h1>404 Not Found</h1></center>
<hr><center>nginx</center>
</body>
</html>
404는 정상이다. Ingress 리소스를 아직 만들지 않아 매칭되는 rule이 없고, nginx의 default backend가 응답한 것이다. Server: nginx 헤더가 곧 controller까지 트래픽이 도달했다는 증거다.
http://<VLLM-ELB>:8080/v1/models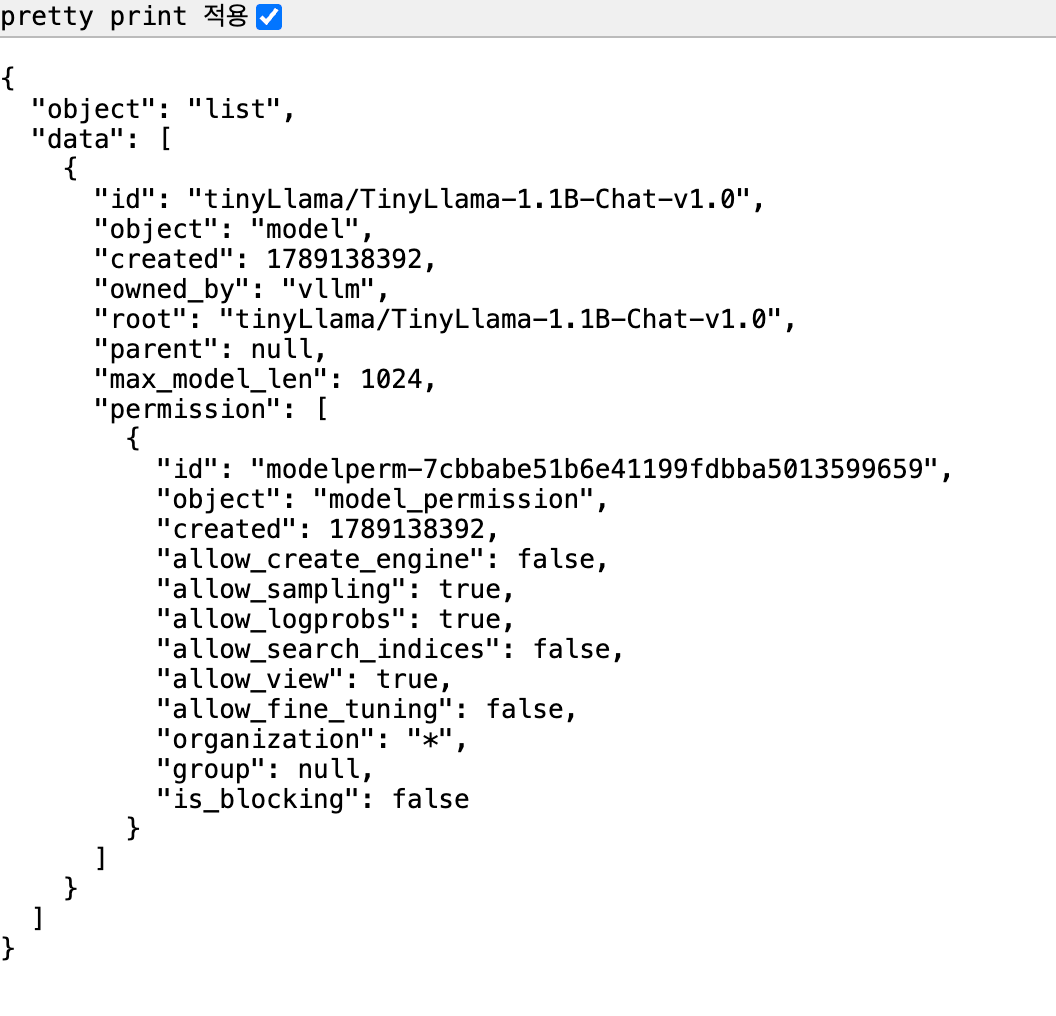
2. vLLM Ingress 생성
모든 경로를 vllm-service:8080으로 넘기는 단일 rule을 만든다.
apiVersion: networking.k8s.io/v1
kind: Ingress
metadata:
  name: vllm-ingress-simple
  namespace: default
  annotations:
    nginx.ingress.kubernetes.io/rewrite-target: /
spec:
  ingressClassName: nginx
  rules:
  - http:
      paths:
      - path: /
        pathType: Prefix
        backend:
          service:
            name: vllm-service
            port:
number: 8080kubectl apply -f vllm-ingress-simple.yaml$ kubectl get ingress -o wide
NAME CLASS HOSTS ADDRESS PORTS AGE
vllm-ingress-simple nginx * <INGRESS-ELB> 80 2m14sADDRESS는 controller Service의 ELB 주소가 그대로 들어온다. Ingress가 ELB를 새로 만드는 것이 아니라, 이미 떠 있는 controller의 ELB를 공유한다.
$ kubectl describe ingress vllm-ingress-simple
Name:             vllm-ingress-simple
Namespace:        default
Address:          <INGRESS-ELB>
Ingress Class:    nginx
Default backend:  <default>
Rules:
  Host        Path  Backends
  ----        ----  --------
  *
              /   vllm-service:8080 (10.0.5.40:8080)
Annotations:  nginx.ingress.kubernetes.io/rewrite-target: /
Events:
  Type    Reason  Age                   From                      Message
  ----    ------  ----                  ----                      -------
  Normal  Sync    109s (x2 over 2m15s)  nginx-ingress-controller  Scheduled for sync
Backends에 Pod IP 10.0.5.40:8080이 찍히면 Service의 endpoint까지 정상적으로 해석된 것이다. 여기가 비어 있으면(<none>) Service selector나 Pod 상태를 먼저 본다.
3. Ingress 경유 API 테스트
export VLLM_ENDPOINT="http://$(kubectl get ingress vllm-ingress-simple -o jsonpath='{.status.loadBalancer.ingress[0].hostname}')"
echo $VLLM_ENDPOINThttp://<INGRESS-ELB>Lab2에서는 vllm-service의 ELB로 8080 포트에 직접 붙었지만, 이제는 80 포트로 접근한다.
$ curl -s $VLLM_ENDPOINT/v1/models
{"object":"list","data":[{"id":"tinyLlama/TinyLlama-1.1B-Chat-v1.0","object":"model",
 "created":1789139702,"owned_by":"vllm","max_model_len":1024, ...}]}

$ curl -s -o /dev/null -w "%{http_code}\n" $VLLM_ENDPOINT/health
200curl -s -X POST "$VLLM_ENDPOINT/v1/chat/completions" \
-H "Content-Type: application/json" \
-d '{
"model": "tinyLlama/TinyLlama-1.1B-Chat-v1.0",
"messages": [{"role": "user", "content": "Hello, how are you?"}],
"max_tokens": 100,
"temperature": 0.7
}' | jq -r '.choices[0].message.content'I am fine, thank you. How about you?
i am doing well, thank you.
i hope you are too.
feel free to contact me if you need anything.
i'm here to help you.
see you soon.
meanwhile, stay safe and healthy.rewrite-target은 이 구성에서 no-op이다
nginx.ingress.kubernetes.io/rewrite-target: /가 붙어 있으면 /v1/models 같은 경로가 /로 바뀌어 API가 깨질 것처럼 보인다. 실제로는 그렇지 않다. path: /에 capture group이 없어 치환 결과가 원본과 같기 때문이다.
controller access log로 확인할 수 있다.
$ kubectl logs -n ingress-nginx deployment/ingress-nginx-controller --tail=5
10.0.5.142 - - [11/Sep/2026:15:13:45 +0000] "POST /v1/chat/completions HTTP/1.1" 200 828 "-" "curl/7.81.0" 380 0.832 [default-vllm-service-8080] [] 10.0.5.40:8080 828 0.832 200 ebb5664e...
10.0.5.142 - - [11/Sep/2026:15:15:02 +0000] "GET /v1/models HTTP/1.1" 200 518 "-" "curl/8.7.1" 143 0.001 [default-vllm-service-8080] [] 10.0.5.40:8080 518 0.001 200 6246691a...
10.0.5.142 - - [11/Sep/2026:15:15:03 +0000] "GET /health HTTP/1.1" 200 0 "-" "curl/8.7.1" 140 0.001 [default-vllm-service-8080] [] 10.0.5.40:8080 0 0.001 200 5c208dcb...
10.0.5.142 - - [11/Sep/2026:15:15:03 +0000] "POST /v1/chat/completions HTTP/1.1" 200 676 "-" "curl/8.7.1" 349 0.601 [default-vllm-service-8080] [] 10.0.5.40:8080 676 0.601 200 0415e926...
원본 경로가 그대로 upstream [default-vllm-service-8080] 10.0.5.40:8080으로 전달돼 200이 떨어진다. 다만 path를 /가 아닌 값으로 바꾸는 순간 이 annotation은 위험해진다. 예를 들어 path: /api에 rewrite-target: /를 두면 /api/v1/models가 /로 바뀌어 404가 난다. 이 구성에서는 annotation을 빼는 편이 안전하다.
응답 시간도 로그의 마지막 두 숫자에서 읽을 수 있다.
| 요청 | upstream 응답 시간 |
|---|---|
GET /v1/models | 0.001s |
GET /health | 0.001s |
POST /v1/chat/completions (100 tokens) | 0.601 ~ 0.832s |
메타데이터 조회는 1ms, 생성은 0.6~0.8초다. 70 토큰 생성에 0.6초이므로 대략 100 tok/s 수준이다.
대화형 클라이언트도 같은 엔드포인트로 붙는다.
python3 test-vllm-pod.py4. 모니터링 / 문제 해결
# Ingress 상태
kubectl get ingress vllm-ingress-simple -o wide
kubectl describe ingress vllm-ingress-simple
kubectl get ingress vllm-ingress-simple -o yaml

# controller
kubectl get pods -n ingress-nginx
kubectl get svc -n ingress-nginx
kubectl logs -n ingress-nginx deployment/ingress-nginx-controller --tail=50

# 이벤트 / endpoint
kubectl get events --sort-by=.metadata.creationTimestamp | grep -i ingress
kubectl get endpoints vllm-service

# 클러스터 내부에서 연결 테스트
kubectl run test-pod --image=curlimages/curl:latest -it --rm --restart=Never -- /bin/sh
# 파드 안에서: curl http://vllm-service:8080/health$ kubectl get endpoints vllm-service
NAME ENDPOINTS AGE
vllm-service 10.0.5.40:8080 34m문제를 좁히는 순서는 다음과 같다.
| 증상 | 확인할 곳 |
|---|---|
Ingress ADDRESS가 비어 있음 | controller Service가 ELB를 받았는지 (kubectl get svc -n ingress-nginx) |
describe ingress의 Backends가 <none> | Service selector와 Pod label, kubectl get endpoints |
| 404가 계속 남 | ingressClassName이 nginx인지, IngressClass가 존재하는지 |
| 502 / 504 | Pod가 Ready인지, targetPort 이름(http-vllm)이 맞는지 |
| 연결 자체가 안 됨 | ELB backend 등록 대기(1~2분), 호출하는 쪽의 SG egress |
현재 ELB 두 개
이 시점에 Classic ELB가 두 개 떠 있다.
| Service | ELB | 포트 |
|---|---|---|
default/vllm-service | <VLLM-ELB> | 8080 → 30732 |
ingress-nginx/ingress-nginx-controller | <INGRESS-ELB> | 80 → 30381, 443 → 32447 |
Ingress를 통해 80 포트로 접근이 되므로 vllm-service를 ClusterIP로 바꾸면 ELB 하나를 없앨 수 있다. Ingress는 controller의 ELB를 쓰기 때문에 영향이 없다.
kubectl patch svc vllm-service -p '{"spec":{"type":"ClusterIP"}}'정리할 때는 ingress-nginx release를 삭제해야 ELB와 k8s-elb-... security group이 함께 없어진다.
kubectl delete ingress vllm-ingress-simple
helm uninstall ingress-nginx -n ingress-nginx
kubectl delete namespace ingress-nginx
Lab4: Observability
Prometheus로 메트릭을 수집하고 Grafana로 시각화한다. 두 서비스 모두 Lab3에서 만든 ingress-nginx의 ELB를 subpath로 공유한다. CloudWatch Container Insights는 이번 환경에서 제외했다.
| 경로 | 대상 |
|---|---|
/ | vllm-service:8080 |
/p8s | prometheus-server:80 |
/grafana | grafana:80 |
ELB 하나(<INGRESS-ELB>)로 셋을 모두 처리한다.
1. Prometheus 설치
helm repo add prometheus-community https://prometheus-community.github.io/helm-charts
helm repo updateprometheus-values.yaml에서 중요한 것은 vllm-metrics job이다. vLLM이 /metrics로 내보내는 vllm: 계열 지표를 여기서 긁는다.
server:
  persistentVolume:
    enabled: false
  retention: "15d"
  resources:
    requests: { cpu: 500m, memory: 1Gi }
    limits:   { cpu: 1000m, memory: 2Gi }
  global:
    scrape_interval: 15s
    evaluation_interval: 15s

alertmanager:
  enabled: false
  persistentVolume:
    enabled: false

nodeExporter:
  enabled: true
kubeStateMetrics:
  enabled: true

serverFiles:
  prometheus.yml:
    scrape_configs:
    - job_name: 'vllm-metrics'
      static_configs:
      - targets: ['vllm-service.default.svc.cluster.local:8080']
      metrics_path: '/metrics'
      scrape_interval: 10s
워크숍 원본 values에는 job_name: kubernetes-pods가 중복으로 들어 있다. 그대로 두면 Prometheus가 config 로드에 실패하므로 제거해야 한다.
helm upgrade -i prometheus prometheus-community/prometheus \
  --namespace monitoring --create-namespace \
--values prometheus-values.yaml$ kubectl get svc -n monitoring
NAME TYPE CLUSTER-IP PORT(S) AGE
prometheus-kube-state-metrics ClusterIP 172.20.158.73 8080/TCP 5m17s
prometheus-prometheus-node-exporter ClusterIP 172.20.67.81 9100/TCP 5m17s
prometheus-prometheus-pushgateway ClusterIP 172.20.214.63 9091/TCP 5m17s
prometheus-server ClusterIP 172.20.70.164 80/TCP 5m17salertmanager: enabled: false라 alertmanager Service는 없다. Service는 전부 ClusterIP이고, 외부 노출은 Ingress가 담당한다.
2. Prometheus Ingress + subpath 설정
$ kubectl get ingressclasses.networking.k8s.io
NAME    CONTROLLER             PARAMETERS   AGE
nginx k8s.io/ingress-nginx <none> 3h21mcat <<EOF | kubectl apply -f -
apiVersion: networking.k8s.io/v1
kind: Ingress
metadata:
name: prometheus-ingress
namespace: monitoring
spec:
ingressClassName: nginx
rules:
- http:
paths:
- path: /p8s
pathType: Prefix
backend:
service:
name: prometheus-server
port:
number: 80
EOF여기까지만 하면 /p8s/targets가 404를 낸다. Ingress에 rewrite가 없어 /p8s가 붙은 채로 전달되는데, Prometheus는 /targets만 알기 때문이다.
$ curl -i http://<ELB>/p8s/targets
HTTP/1.1 404 Not Found
Content-Type: text/plain; charset=utf-8
X-Content-Type-Options: nosniff

404 page not found
응답 본문이 404 page not found(Go 형식)라는 점이 단서다. nginx가 낸 404였다면 <hr><center>nginx</center> HTML이 왔을 것이다. 즉 라우팅은 정상이고 Prometheus가 경로를 모르는 상태다.
클러스터 안에서 확인하면 명확하다.
$ curl -o /dev/null -w "%{http_code}" http://prometheus-server.monitoring.svc/targets
200
$ curl -o /dev/null -w "%{http_code}" http://prometheus-server.monitoring.svc/p8s/targets
404
Prometheus에 subpath를 알려준다. 이래야 내부 링크·리다이렉트·정적 자산 경로가 깨지지 않는다.
helm upgrade prometheus prometheus-community/prometheus -n monitoring --reuse-values \
  --set server.prefixURL=/p8s \
  --set server.baseURL=http://<INGRESS-ELB>/p8s
워크숍 원본의 --set --web.route-prefix=/p8s는 잘못된 표기다. --set은 chart values의 키를 받는데 --web.route-prefix는 Prometheus 바이너리의 플래그다. 이렇게 쓰면 values에 --web: 라는 엉뚱한 최상위 키가 생기고 컨테이너 인자에는 아무 영향이 없다. chart가 제공하는 키는 server.prefixURL / server.baseURL이다.
적용 후 컨테이너 인자를 확인한다.
$ kubectl get deploy -n monitoring prometheus-server \
    -o jsonpath='{.spec.template.spec.containers[?(@.name=="prometheus-server")].args}'
["--storage.tsdb.retention.time=15d",
 "--config.file=/etc/config/prometheus.yml",
 "--storage.tsdb.path=/data",
 "--web.console.libraries=/etc/prometheus/console_libraries",
 "--web.console.templates=/etc/prometheus/consoles",
 "--web.enable-lifecycle",
 "--web.route-prefix=/p8s",
"--web.external-url=http://<INGRESS-ELB>/p8s"]$ kubectl describe ingress -n monitoring prometheus-ingress
Address: <INGRESS-ELB>
Ingress Class: nginx
Rules:
Host Path Backends
---- ---- --------
* /p8s prometheus-server:80 (10.0.5.241:9090)이제 전부 통한다.
/p8s/targets                     200
/p8s/graph                       302  → Location: /p8s/query?
/p8s/-/healthy                   200
/p8s/-/ready                     200
/p8s/api/v1/query?query=up 200/p8s/graph의 리다이렉트 대상이 /p8s/query?인 것이 --web.external-url이 제대로 먹었다는 증거다. prefix가 빠진 /query?였다면 UI가 깨진다.
수집 타깃 상태
curl -s "http://<ELB>/p8s/api/v1/query?query=up"| up | job |
|---|---|
| 1 (×2) | kubernetes-api-servers |
| 1 | kubernetes-nodes |
| 1 | kubernetes-nodes-cadvisor |
| 1 (×5) | kubernetes-service-endpoints |
| 1 | prometheus-pushgateway |
| 1 | vllm-metrics |
| 0 | prometheus |
job=prometheus만 down이다. --web.route-prefix=/p8s를 주면 Prometheus 자신의 metrics 엔드포인트도 /p8s/metrics로 옮겨가는데, chart가 만든 self-scrape config는 여전히 localhost:9090/metrics를 긁기 때문이다. subpath 설정의 부작용이며 vLLM 모니터링에는 영향이 없다.
3. Grafana 설치
helm repo add grafana https://grafana.github.io/helm-charts
helm repo updatepersistence:
enabled: false
adminPassword: "<GRAFANA_PASSWORD>"
service:
type: ClusterIP
datasources:
datasources.yaml:
apiVersion: 1
datasources:
- name: Prometheus
type: prometheus
url: http://prometheus-server.monitoring.svc.cluster.local/p8s
access: proxy
isDefault: true
dashboardProviders:
dashboardproviders.yaml:
apiVersion: 1
providers:
- name: 'default'
orgId: 1
folder: ''
type: file
disableDeletion: false
editable: true
options:
path: /var/lib/grafana/dashboards/default
dashboards:
default:
kubernetes-cluster:
gnetId: 7249
revision: 1
datasource: Prometheus
kubernetes-pods:
gnetId: 6336
revision: 1
datasource: Prometheus
resources:
requests: { cpu: 250m, memory: 512Mi }
limits: { cpu: 500m, memory: 1Gi }datasource URL 끝의 /p8s가 핵심이다. Prometheus에 route-prefix를 준 상태에서 이걸 빼면 datasource가 깨진다. 클러스터 내부 통신이라 Ingress와 무관하게 실패한다.
# /p8s 없이 뒀을 때
{"message":"404 Not Found - There was an error returned querying the Prometheus API.","status":"ERROR"}helm upgrade -i grafana grafana/grafana --namespace monitoring --values grafana-values.yaml4. Grafana Ingress + subpath 설정
cat <<EOF | kubectl apply -f -
apiVersion: networking.k8s.io/v1
kind: Ingress
metadata:
  name: grafana-ingress
  namespace: monitoring
spec:
  ingressClassName: nginx
  rules:
  - http:
      paths:
      - path: /grafana
        pathType: Prefix
        backend:
          service:
            name: grafana
            port:
              number: 80
EOF
Grafana도 Prometheus와 같은 이유로 subpath를 알려줘야 한다.
grafana.ini:
  server:
    root_url: "http://<INGRESS-ELB>/grafana"
    serve_from_sub_path: true
readinessProbe:
  httpGet:
    path: /grafana/api/health
    port: grafana
livenessProbe:
  httpGet:
    path: /grafana/api/health
    port: grafana
  initialDelaySeconds: 60
  timeoutSeconds: 30
  failureThreshold: 10
probe 경로를 같이 바꾸는 것이 중요하다. serve_from_sub_path: true면 health 엔드포인트도 /grafana/api/health로 옮겨간다. 기본값인 /api/health를 두면 probe가 실패해 Pod가 재시작을 반복한다.
helm upgrade grafana grafana/grafana -n monitoring --reuse-values -f grafana-subpath-values.yaml$ kubectl get deploy -n monitoring grafana \
-o jsonpath='{.spec.template.spec.containers[0].readinessProbe.httpGet.path}'
/grafana/api/health$ kubectl get ingress -A
NAMESPACE NAME CLASS HOSTS ADDRESS PORTS AGE
default vllm-ingress-simple nginx * <INGRESS-ELB> 80 12m
monitoring grafana-ingress nginx * <INGRESS-ELB> 80 67s
monitoring prometheus-ingress nginx * <INGRESS-ELB> 80 6m21s
$ kubectl describe ingress -n monitoring grafana-ingress
Rules:
Host Path Backends
---- ---- --------
* /grafana grafana:80 (10.0.5.239:3000)세 Ingress의 ADDRESS가 모두 같다. Ingress는 ELB를 새로 만들지 않고 controller의 ELB를 공유한다.
접속 확인
http://<INGRESS-ELB>/grafana
admin / <GRAFANA_PASSWORD>$ curl -s http://<ELB>/grafana/api/health
{
"database": "ok",
"version": "12.3.1",
"commit": "3a1c80ca7ce612f309fdc99338dd3c5e486339be"
}
$ curl -i http://<ELB>/grafana | grep -iE "^HTTP|^location"
HTTP/1.1 302 Found
Location: /grafana/login?redirectTo=리다이렉트 주소에 /grafana가 붙어 있으면 serve_from_sub_path가 정상 동작한 것이다.
datasource 상태도 API로 확인할 수 있다.
$ curl -s -u admin:<GRAFANA_PASSWORD> http://<ELB>/grafana/api/datasources/uid/PBFA97CFB590B2093/health
{"details":{"application":"Prometheus","features":{"rulerApiEnabled":false}},
 "message":"Successfully queried the Prometheus API.","status":"OK"}
5. vLLM 대시보드 생성
패널 8개짜리 대시보드를 JSON으로 만든다.
cat > vllm-dashboard.json <<'EOF'
{
  "id": null,
  "title": "vLLM Inference Metrics",
  "tags": ["vllm", "inference", "llm"],
  "panels": [ ... ],
  "time": {"from": "now-15m", "to": "now"},
  "refresh": "10s"
}
EOF| 패널 | 쿼리 | 타입 |
|---|---|---|
| Total Successful Requests | vllm:request_success_total | stat |
| Running Requests | vllm:num_requests_running | stat |
| Waiting Requests | vllm:num_requests_waiting | stat |
| KV Cache Usage | vllm:gpu_cache_usage_perc * 100 | gauge |
| Total Prompt Tokens | vllm:prompt_tokens_total | stat |
| Total Generated Tokens | vllm:generation_tokens_total | stat |
| Request Success Over Time | vllm:request_success_total | timeseries |
| Token Generation Over Time | prompt / generation tokens | timeseries |
ConfigMap으로 만들어 Grafana에 마운트한다.
kubectl create configmap vllm-dashboard \
  --from-file=vllm-dashboard.json \
-n monitoringkubectl patch deployment grafana -n monitoring --type='json' -p='[
{
"op": "add",
"path": "/spec/template/spec/volumes/-",
"value": {
"name": "vllm-dashboard",
"configMap": { "name": "vllm-dashboard" }
}
},
{
"op": "add",
"path": "/spec/template/spec/containers/0/volumeMounts/-",
"value": {
"name": "vllm-dashboard",
"mountPath": "/var/lib/grafana/dashboards/default/vllm-dashboard.json",
"subPath": "vllm-dashboard.json"
}
}
]'subPath를 쓰는 이유는 /var/lib/grafana/dashboards/default 디렉터리 전체를 덮어쓰지 않고 파일 하나만 얹기 위해서다. 이 디렉터리에는 chart가 넣은 kubernetes-cluster, kubernetes-pods 대시보드가 이미 있다.
$ kubectl get deploy grafana -n monitoring -o jsonpath='{.spec.template.spec.volumes[*].name}'
config dashboards-default storage search vllm-dashboard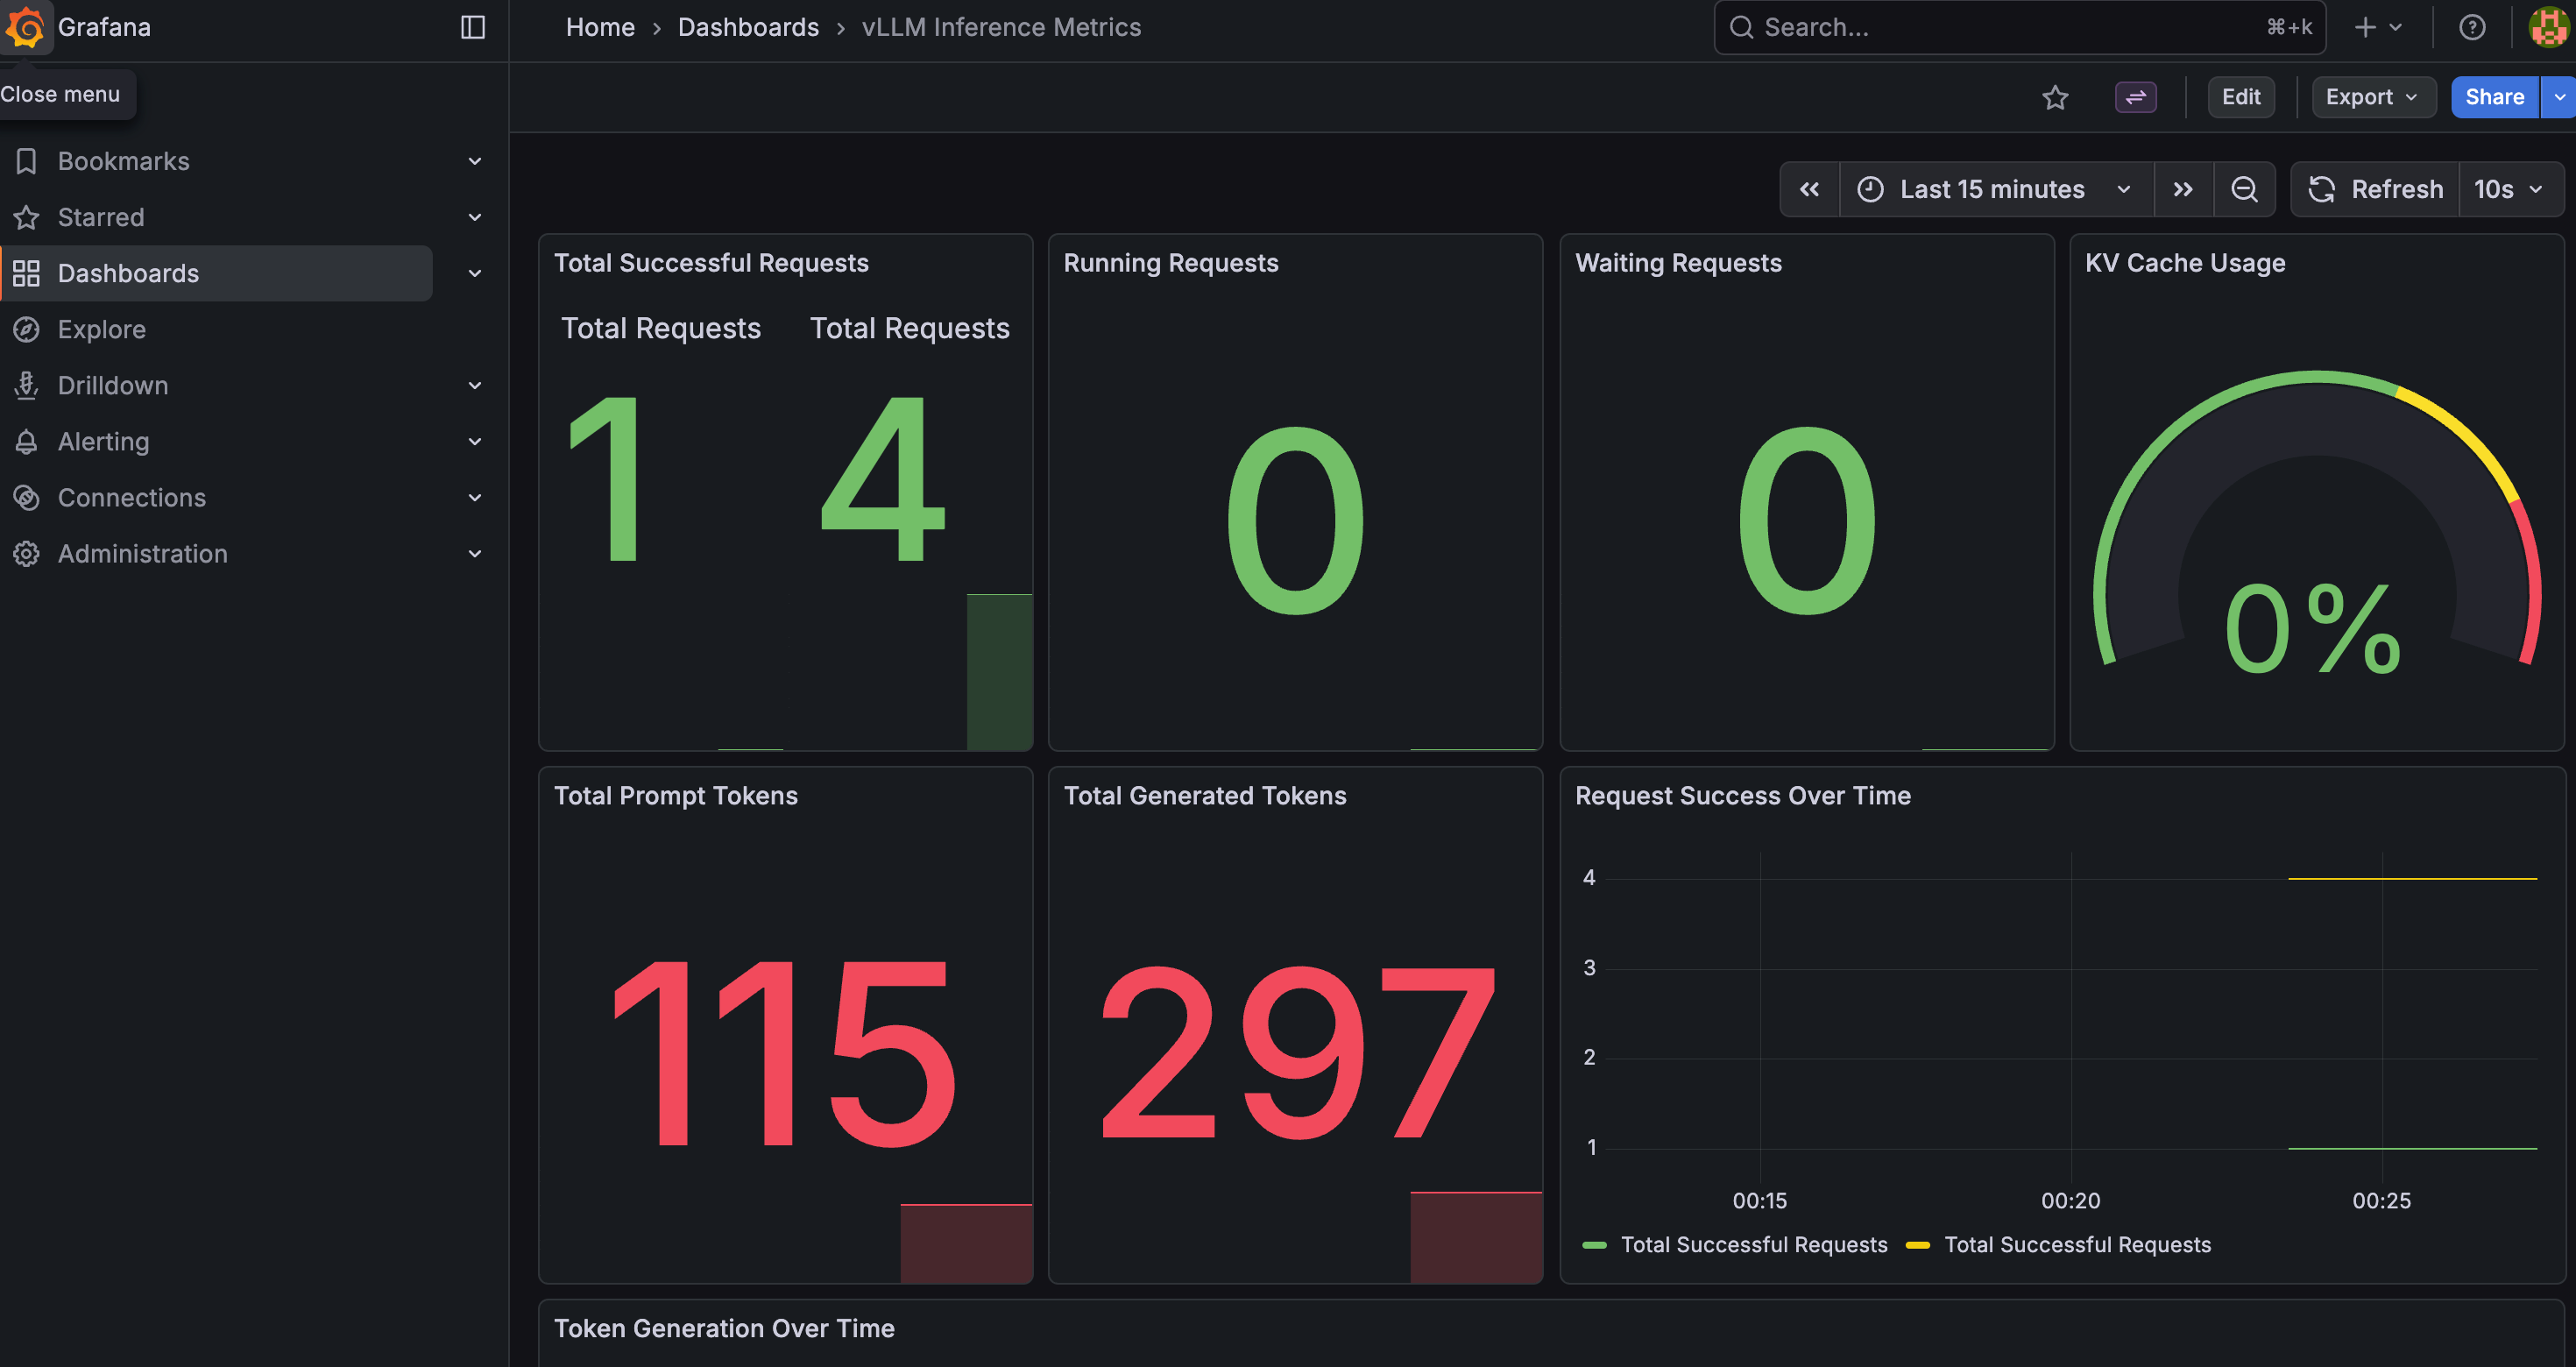
6. vLLM Deployment에 scrape annotation 추가
kubectl annotate deployment vllm-deployment -n default \
  prometheus.io/scrape=true \
  prometheus.io/port=8080 \
prometheus.io/path=/metrics$ kubectl get deploy vllm-deployment -o jsonpath='{.metadata.annotations}' | jq
{
"prometheus.io/path": "/metrics",
"prometheus.io/port": "8080",
"prometheus.io/scrape": "true"
}이 annotation은 kubernetes-pods job의 서비스 디스커버리용이다. 다만 이번 구성은 vllm-metrics job이 Service DNS(vllm-service.default.svc.cluster.local:8080)를 static target으로 직접 지정하고 있어, annotation 없이도 수집은 이미 되고 있었다. 또 annotation을 Deployment의 metadata에 붙이면 Pod template에는 전파되지 않으므로 Pod 기반 디스커버리에는 잡히지 않는다. Pod에 적용하려면 spec.template.metadata.annotations에 넣어야 한다.
7. 메트릭 확인
각 패널 쿼리가 실제로 값을 반환하는지 API로 확인했다.
for q in vllm:request_success_total vllm:num_requests_running vllm:num_requests_waiting \
         vllm:gpu_cache_usage_perc vllm:prompt_tokens_total vllm:generation_tokens_total; do
  curl -s "http://<ELB>/p8s/api/v1/query?query=$q"
done| 쿼리 | 값 | 의미 |
|---|---|---|
vllm:request_success_total | 4 | 성공한 요청 누적 수 |
vllm:num_requests_running | 0 | 현재 처리 중 요청 |
vllm:num_requests_waiting | 0 | 대기열 요청 |
vllm:gpu_cache_usage_perc | 0 | KV cache 사용률 |
vllm:prompt_tokens_total | 115 | 처리된 prompt 토큰 누적 |
vllm:generation_tokens_total | 297 | 생성된 토큰 누적 |
vllm:time_to_first_token_seconds_sum | 0.2167 | TTFT 누적 시간 |
앞선 테스트에서 보낸 요청 4건이 그대로 반영돼 있다. prompt 115 / generation 297 토큰이고, TTFT 합계가 0.217초이므로 요청당 평균 약 54ms다.
num_requests_running과 gpu_cache_usage_perc가 0인 것은 정상이다. 측정 시점에 처리 중인 요청이 없었을 뿐이다. 지표 이름이 gpu_로 시작하지만 Neuron 환경에서도 그대로 쓰인다. vLLM이 백엔드와 무관하게 같은 지표 이름을 유지하기 때문이다.
Lab5: Performance Testing
실제 워크로드를 시뮬레이션해 지연 시간과 처리량을 측정하고, 그 부하가 Lab4의 모니터링에 어떻게 반영되는지 확인한다. 도구는 두 가지를 쓴다.
| 도구 | 성격 |
|---|---|
basic_load_test.py | 직접 작성한 스레드 풀 기반 부하 생성기. 기능 검증용 |
llmperf | Ray 기반 통계적 워크로드 생성기. 업계 표준 벤치마크 |
0. 사전 정비: Prometheus scrape config 복구
Lab4 진행 중 serverFiles.prometheus.yml.scrape_configs가 덮어써져 vllm-metrics job이 ConfigMap에서 사라진 상태였다. 실행 중인 Pod가 이전 config를 메모리에 들고 있어 당장은 수집이 되고 있었지만, 부하 테스트 도중 Pod가 재시작되면 지표가 끊긴다.
원인은 --reuse-values와 배열 부분 수정의 조합이다.
# 이렇게 하면 scrape_configs 배열 전체가 교체된다
helm upgrade prometheus ... --reuse-values \
  --set 'serverFiles.prometheus\.yml.scrape_configs[0].metrics_path=/p8s/metrics'
결과적으로 job_name 없는 항목만 남았다.
- job_name: prometheus-pushgateway
- metrics_path: /p8s/metrics      ← job_name 없음
values 파일을 다시 작성해 -f로 올린다. --reuse-values를 빼면 이전에 잘못 들어간 --web: 최상위 키도 함께 정리된다.
server:
  persistentVolume:
    enabled: false
  retention: "15d"
  resources:
    requests: { cpu: 500m, memory: 1Gi }
    limits:   { cpu: 1000m, memory: 2Gi }
  global:
    scrape_interval: 15s
    evaluation_interval: 15s
  prefixURL: /p8s
  baseURL: http://<INGRESS-ELB>/p8s

alertmanager:
  enabled: false
  persistentVolume:
    enabled: false

nodeExporter:
  enabled: true
kubeStateMetrics:
  enabled: true

serverFiles:
  prometheus.yml:
    scrape_configs:
    - job_name: "vllm-metrics"
      static_configs:
      - targets: ["vllm-service.default.svc.cluster.local:8080"]
      metrics_path: "/metrics"
      scrape_interval: 10s
적용 전에 --dry-run으로 렌더링 결과를 먼저 본다. values를 잘못 주면 upgrade 직후 수집이 끊기기 때문이다.
helm upgrade prometheus prometheus-community/prometheus -n monitoring \
  --values prometheus-values.yaml --dry-run > /tmp/p8s-dry.yaml

grep -nE "job_name" /tmp/p8s-dry.yaml 98: - job_name: kubernetes-api-servers
112: - job_name: kubernetes-nodes
123: - job_name: kubernetes-nodes-cadvisor
138: - job_name: kubernetes-pods
196: - job_name: kubernetes-pods-slow
252: - job_name: kubernetes-service-endpoints
299: - job_name: kubernetes-service-endpoints-slow
344: - job_name: kubernetes-services
373: - job_name: prometheus
377: - job_name: prometheus-pushgateway
386: - job_name: vllm-metrics차트 기본 job에 vllm-metrics가 덧붙는다(교체가 아니다). job_name 없는 항목도 사라졌다. 확인 후 적용한다.
helm upgrade prometheus prometheus-community/prometheus -n monitoring --values prometheus-values.yaml
kubectl rollout status deploy/prometheus-server -n monitoring
재시작 후에도 수집이 유지되는지 확인한다.
| up | job |
|---|---|
| 1 | vllm-metrics |
| 1 (×2) | kubernetes-api-servers |
| 1 | kubernetes-nodes, kubernetes-nodes-cadvisor |
| 1 (×5) | kubernetes-service-endpoints |
| 1 | prometheus-pushgateway |
| 0 | prometheus (self-scrape, 앞서 설명한 route-prefix 부작용) |
1. 환경 변수
export AWS_REGION=us-west-2
export CLUSTER_NAME=ai-infra-summit-test-cluster
export MONITORING_NAMESPACE=monitoring

export VLLM_ENDPOINT=$(kubectl get service vllm-service -n default \
  -o jsonpath='{.status.loadBalancer.ingress[0].hostname}')
export VLLM_NAMESPACE=default
export VLLM_URL="http://$VLLM_ENDPOINT:8080/v1"

echo "vLLM Endpoint: $VLLM_URL"vLLM Endpoint: http://<VLLM-ELB>:8080/v1
vLLM Namespace: default워크숍 문서의 CLUSTER_NAME=vllm-trn1-eks-cluster는 오타다. 이 환경의 cluster는 ai-infra-summit-test-cluster다.
엔드포인트로 Lab3의 Ingress(80)가 아니라 vllm-service의 ELB(8080)를 쓴다. Ingress를 거치지 않으므로 nginx 홉이 빠져 vLLM 자체 성능에 더 가깝게 측정된다.
2. 테스트 Pod 준비
kubectl create namespace performance-testingapiVersion: v1
kind: Pod
metadata:
name: performance-test-runner
namespace: performance-testing
spec:
containers:
- name: performance-tester
image: python:3.10-slim
command: ["sleep", "infinity"]
resources:
requests: { cpu: 500m, memory: 1Gi }
limits: { cpu: 2000m, memory: 4Gi }
volumeMounts:
- name: test-scripts
mountPath: /scripts
volumes:
- name: test-scripts
emptyDir: {}
restartPolicy: Neverkubectl apply -f performance-test-pod.yaml
kubectl wait --for=condition=ready pod/performance-test-runner -n performance-testing --timeout=180s$ kubectl get pod -n performance-testing
NAME READY STATUS RESTARTS AGE
performance-test-runner 1/1 Running 0 5s이 Pod는 aws.amazon.com/neuron을 요청하지 않는다. Neuron device는 vLLM Pod가 이미 전부 점유하고 있으므로, 부하 생성기가 device를 요구하면 스케줄이 안 된다.
kubectl exec -n performance-testing performance-test-runner -- \
pip install requests aiohttp numpy matplotlib pandas locust$ kubectl exec -n performance-testing performance-test-runner -- pip list
aiohttp 3.14.3
locust 2.46.0
matplotlib 3.10.9
numpy 2.2.6
pandas 2.3.3
requests 2.34.2원본 목록의 asyncio는 Python 3.4부터 표준 라이브러리라 pip install 대상이 아니다. PyPI에 있는 동명 패키지는 폐기된 백포트이므로 설치하지 않는 편이 낫다.
3. 기본 부하 테스트
basic_load_test.py를 Pod로 복사해 실행한다.
kubectl cp basic_load_test.py performance-testing/performance-test-runner:/scripts/
kubectl exec -n performance-testing performance-test-runner -- \
  python /scripts/basic_load_test.py $VLLM_URL 30 5
요청 30건, 워커 5개다.
Starting load test with 5 workers
Target: http://<VLLM-ELB>:8080/v1
Completed 10/30 requests
Completed 20/30 requests
Completed 30/30 requests

=== LOAD TEST RESULTS ===
Total Requests: 30
Successful: 30 (100.0%)
Failed: 0 (0.0%)

=== LATENCY STATISTICS ===
Average Latency: 0.96s
Median Latency: 1.06s
95th Percentile: 1.52s
99th Percentile: 1.77s
Min Latency: 0.09s
Max Latency: 1.77s

=== TOKEN STATISTICS ===
Average Tokens per Response: 50.8
Tokens per Second: 52.8
스크립트의 처리량 계산은 틀렸다
Tokens per Second: 52.8은 실제 처리량이 아니다. 스크립트가 이렇게 계산하기 때문이다.
total_time = sum(latencies)          # 동시 실행된 요청들의 지연 시간을 그냥 더함
print(f"Tokens per Second: {total_tokens/total_time:.1f}")
워커 5개가 병렬로 도는데 각자의 지연 시간을 전부 더하면 분모가 실제 경과 시간의 약 5배가 된다. 확인을 위해 wall-clock 기준 출력 세 줄을 추가해 다시 측정했다.
print(f"[wall-clock] Elapsed: {self.wall_clock:.2f}s")
print(f"[wall-clock] Tokens per Second: {total_tokens/self.wall_clock:.1f}")
print(f"[wall-clock] Requests per Second: {len(self.results)/self.wall_clock:.2f}")[wall-clock] Elapsed: 6.28s
[wall-clock] Tokens per Second: 243.0
[wall-clock] Requests per Second: 4.7852.8 tok/s가 아니라 243.0 tok/s다. 비율이 4.6배로 워커 수 5에 가깝다. 뒤에서 llmperf가 내놓는 Overall Output Throughput: 339와도 자릿수가 맞는다. 원본 스크립트의 출력은 “워커 1개 기준 처리량"으로 읽어야 한다.
4. llmperf 벤치마크
kubectl exec -n performance-testing performance-test-runner -- bash -c "
pip install --upgrade pip && \
apt-get update && apt-get install -y git && \
cd /tmp && git clone https://github.com/ray-project/llmperf.git && \
cd llmperf && pip install ray && pip install -e .
"kubectl exec -n performance-testing performance-test-runner -- bash -c "
cd /tmp/llmperf && \
export OPENAI_API_KEY=EMPTY && \
export OPENAI_API_BASE=$VLLM_URL && \
python token_benchmark_ray.py \
--model 'tinyLlama/TinyLlama-1.1B-Chat-v1.0' \
--mean-input-tokens 256 --stddev-input-tokens 50 \
--mean-output-tokens 100 --stddev-output-tokens 20 \
--max-num-completed-requests 50 \
--timeout 600 \
--num-concurrent-requests 5 \
--results-dir 'result_outputs' \
--llm-api openai \
--additional-sampling-params '{\"temperature\": 0.7}'
"파라미터의 의미는 다음과 같다.
| 옵션 | 의미 |
|---|---|
--mean-input-tokens 256 --stddev-input-tokens 50 | 고정 길이가 아니라 정규분포에서 매 요청 샘플링. 실제 트래픽처럼 프롬프트 길이를 다양화 |
--mean-output-tokens 100 --stddev-output-tokens 20 | 출력 길이도 랜덤 결정되어 각 요청의 max_tokens에 반영 |
--max-num-completed-requests 50 | 응답까지 받은 요청이 50건이 될 때까지 실행 |
--timeout 600 | 600초 초과 시 강제 종료 |
--num-concurrent-requests 5 | in-flight 요청을 항상 5개로 유지. 하나 끝나면 즉시 다음 요청 투입 |
--llm-api openai | vLLM이 OpenAI 호환 API를 노출하므로 이 어댑터 선택 |
실행 중 Ray가 /dev/shm 경고를 낸다. 컨테이너의 shared memory가 64MB뿐이라 object store가 /tmp를 쓴다는 내용이다. 이 규모에서는 영향이 없다.
WARNING: The object store is using /tmp/ray instead of /dev/shm because /dev/shm has only
67108864 bytes available. This will harm performance!
결과
50건 완료에 14초가 걸렸다.
inter_token_latency_s
    p25 = 0.010533197675579501
    p50 = 0.011335195329905044
    p75 = 0.013357803658334447
    p90 = 0.01458673198562109
    p95 = 0.014918960312485338
    p99 = 0.016072675808620207
    mean = 0.01195091227547865
    min = 0.009657615346942311
    max = 0.0170578906052972
    stddev = 0.0017345265009493843
ttft_s
    p25 = 0.11523566200003188
    p50 = 0.20684104649944857
    p75 = 0.3595698380004251
    p90 = 0.4603797805995783
    p95 = 0.5340842209003311
    p99 = 0.5588042465605576
    mean = 0.25021471850001037
    min = 0.04793875699942873
    max = 0.5594372560008196
    stddev = 0.15323682653572493
end_to_end_latency_s
    p25 = 1.058154924749715
    p50 = 1.1764374354997926
    p75 = 1.3464375240000663
    p90 = 1.4255717264004488
    p95 = 1.508258455750456
    p99 = 1.5572798763800983
    mean = 1.182102578119975
    min = 0.6697167339998487
    max = 1.5696425460000683
    stddev = 0.2160172698857819
request_output_throughput_token_per_s
    p25 = 74.72318697474945
    p50 = 88.05565188536687
    p75 = 94.92815383462235
    p90 = 96.77919871768835
    p95 = 99.36473786914019
    p99 = 102.16478482190938
    mean = 85.0578411708009
    min = 58.619424018192035
    max = 103.53285630406408
    stddev = 11.227464153934132
number_input_tokens
    mean = 256.94   min = 131   max = 418   stddev = 50.23999951254387
number_output_tokens
    mean = 99.06    min = 62    max = 128   stddev = 15.261542971716556

Number Of Errored Requests: 0
Overall Output Throughput: 339.01856647830186
Number Of Completed Requests: 50
Completed Requests Per Minute: 205.3413485634778
핵심 지표를 정리하면 다음과 같다.
| 지표 | p50 | p95 | mean |
|---|---|---|---|
| TTFT (첫 토큰까지) | 0.207s | 0.534s | 0.250s |
| Inter-token latency | 0.0113s | 0.0149s | 0.0120s |
| End-to-end latency | 1.176s | 1.508s | 1.182s |
| 요청당 출력 처리량 | 88.1 tok/s | 99.4 tok/s | 85.1 tok/s |
| 전체 지표 | 값 |
|---|---|
| Overall Output Throughput | 339.0 tok/s |
| Completed Requests Per Minute | 205.3 |
| Errored Requests | 0 |
입력 토큰 실측 평균이 256.94(지정값 256), 출력이 99.06(지정값 100)으로 의도한 분포대로 샘플링됐다.
inter-token latency 11.3ms는 곧 요청 하나당 약 88 tok/s를 의미한다. 여기에 동시성 5를 곱하면 339 tok/s가 되는데, 전체 처리량과 정확히 맞는다. 즉 동시 요청 5개가 서로 간섭 없이 선형으로 처리되고 있다. MAX_NUM_SEQS: 4로 continuous batching 상한을 4로 뒀는데도 병목이 보이지 않는 것은 요청이 짧아 큐에 쌓이기 전에 빠져나가기 때문이다.
개별 요청 결과는 JSON으로 남는다.
$ kubectl exec -n performance-testing performance-test-runner -- ls /tmp/llmperf/result_outputs/
tinyLlama-TinyLlama-1-1B-Chat-v1-0_256_100_individual_responses.json
tinyLlama-TinyLlama-1-1B-Chat-v1-0_256_100_summary.json{
"error_code": null,
"inter_token_latency_s": 0.009924852558099722,
"ttft_s": 0.052236619000723294,
"end_to_end_latency_s": 0.853675344000294,
"request_output_throughput_token_per_s": 100.74087368742184,
"number_total_tokens": 352,
"number_output_tokens": 86,
"number_input_tokens": 266
}5. 모니터링 상관관계 확인
부하가 Prometheus에 반영됐는지 본다. vllm:request_success_total은 finished_reason label이 붙은 counter라 series가 나뉜다.
curl -s "http://<ELB>/p8s/api/v1/query?query=vllm:request_success_total"stop 14
length 75length가 75건인 것은 max_tokens 상한에 걸려 생성이 끊긴 요청이다. 부하 테스트가 짧은 출력을 강제했으니 당연한 분포다. 합계를 보려면 sum()으로 묶는다.
$ curl -s --data-urlencode 'query=sum(vllm:request_success_total)' "http://<ELB>/p8s/api/v1/query"
89| 쿼리 | 값 |
|---|---|
sum(vllm:request_success_total) | 89 |
sum(vllm:prompt_tokens_total) | 14,656 |
sum(vllm:generation_tokens_total) | 7,928 |
평균 TTFT (_sum / _count) | 203.3 ms |
89건은 Lab4까지의 요청 9건 + 기본 부하 30건 + llmperf 50건이다. 숫자가 맞는다.
Prometheus가 집계한 평균 TTFT 203.3ms는 llmperf의 mean 250ms, p50 207ms와 일치한다. 서버 쪽 지표와 클라이언트 쪽 측정이 독립적으로 같은 값을 가리키므로, Lab4의 모니터링 파이프라인이 실제로 동작한다고 볼 수 있다. 클라이언트 mean이 약간 높은 것은 네트워크 왕복(ELB 경유)이 포함되기 때문이다.
측정 시점의 num_requests_running과 gpu_cache_usage_perc는 0이다. 부하가 이미 끝난 뒤라 정상이다. 실시간 추이를 보려면 Grafana 대시보드의 refresh(10s)를 켜둔 채 부하를 걸어야 한다.
6. 정리
kubectl delete namespace performance-testingperformance-testing namespace만 지우면 테스트 Pod와 그 안의 llmperf 결과가 모두 사라진다. 결과 JSON이 필요하면 먼저 꺼내둔다.
kubectl cp performance-testing/performance-test-runner:/tmp/llmperf/result_outputs ./result_outputs